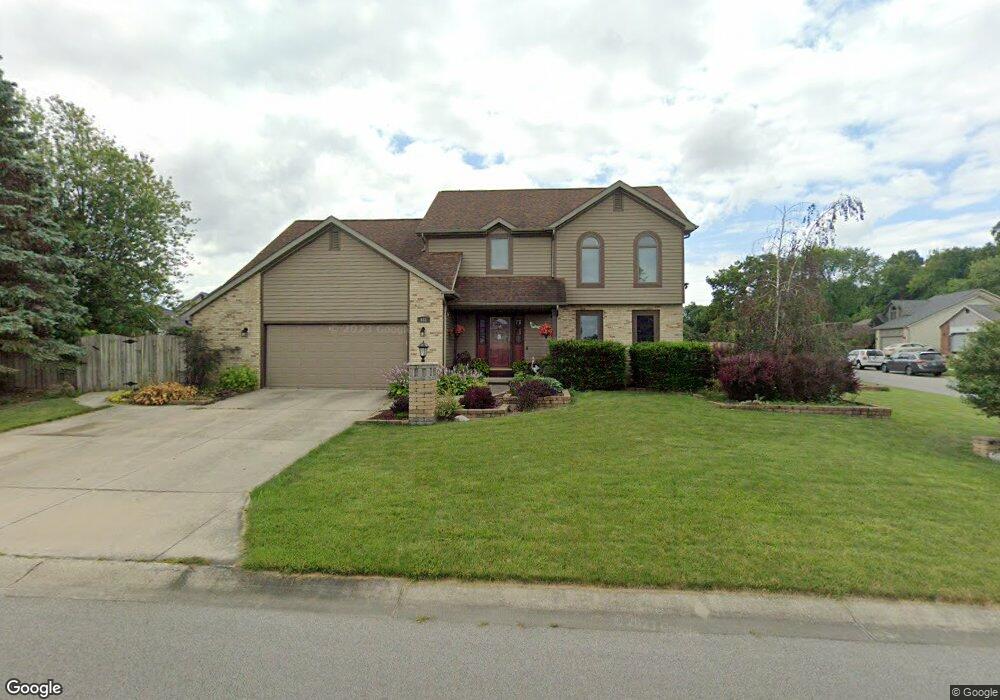
631 Fox Orchard Run Fort Wayne, IN 46825
Northwest Fort Wayne NeighborhoodEstimated Value: $330,000 - $385,000
3
Beds
3
Baths
2,247
Sq Ft
$154/Sq Ft
Est. Value
About This Home
This home is located at 631 Fox Orchard Run, Fort Wayne, IN 46825 and is currently estimated at $347,118, approximately $154 per square foot. 631 Fox Orchard Run is a home located in Allen County with nearby schools including Washington Center Elementary School, Shawnee Middle School, and Northrop High School.
Ownership History
Date
Name
Owned For
Owner Type
Purchase Details
Closed on
Jun 3, 2016
Bought by
Thompson Brian
Current Estimated Value
Home Financials for this Owner
Home Financials are based on the most recent Mortgage that was taken out on this home.
Original Mortgage
$160,866
Outstanding Balance
$128,406
Interest Rate
3.66%
Estimated Equity
$218,712
Purchase Details
Closed on
Feb 12, 2007
Sold by
Mortgage Guaranty Insurance Corp
Bought by
Thompson Brian C and Thompson Machelle S
Home Financials for this Owner
Home Financials are based on the most recent Mortgage that was taken out on this home.
Original Mortgage
$170,500
Interest Rate
6.27%
Mortgage Type
Purchase Money Mortgage
Purchase Details
Closed on
Sep 21, 2006
Sold by
Novastar Mortgage Inc
Bought by
Mortgage Guaranty Insurance Corp
Purchase Details
Closed on
Jun 19, 2006
Sold by
Keech Sharon A and Keech Billy M
Bought by
Novastar Mortgage Inc
Create a Home Valuation Report for This Property
The Home Valuation Report is an in-depth analysis detailing your home's value as well as a comparison with similar homes in the area
Home Values in the Area
Average Home Value in this Area
Purchase History
| Date | Buyer | Sale Price | Title Company |
|---|---|---|---|
| Thompson Brian | -- | -- | |
| Thompson Brian C | -- | None Available | |
| Mortgage Guaranty Insurance Corp | -- | None Available | |
| Novastar Mortgage Inc | -- | Professionals Title Services |
Source: Public Records
Mortgage History
| Date | Status | Borrower | Loan Amount |
|---|---|---|---|
| Open | Thompson Brian | $160,866 | |
| Closed | Thompson Brian | -- | |
| Previous Owner | Thompson Brian C | $170,500 |
Source: Public Records
Tax History Compared to Growth
Tax History
| Year | Tax Paid | Tax Assessment Tax Assessment Total Assessment is a certain percentage of the fair market value that is determined by local assessors to be the total taxable value of land and additions on the property. | Land | Improvement |
|---|---|---|---|---|
| 2024 | $3,755 | $332,600 | $28,300 | $304,300 |
| 2023 | $3,755 | $318,600 | $28,300 | $290,300 |
| 2022 | $3,213 | $280,400 | $28,300 | $252,100 |
| 2021 | $2,794 | $244,200 | $28,300 | $215,900 |
| 2020 | $2,523 | $225,500 | $28,300 | $197,200 |
| 2019 | $2,373 | $211,300 | $28,300 | $183,000 |
| 2018 | $2,390 | $203,500 | $28,300 | $175,200 |
| 2017 | $2,366 | $196,800 | $28,300 | $168,500 |
| 2016 | $2,266 | $191,000 | $28,300 | $162,700 |
| 2014 | $2,056 | $180,400 | $28,300 | $152,100 |
| 2013 | $2,012 | $174,600 | $28,300 | $146,300 |
Source: Public Records
Map
Nearby Homes
- 307 Chisholm Place
- 212 Caperiole Place
- 224 Chisholm Place
- 816 Woodland Springs Place
- 103 Caperiole Place
- 8319 Westridge Rd
- 1132 Fox Orchard Run
- 7835 Claridge Place
- 9208 Olmston Dr
- 1405 Windsor Rd
- 8126 Coldwater Rd
- 1072 Emilee Ct
- 1074 Emilee Ct
- 9286 Colchester Terrace
- 7832 Coldwater Rd
- 1093 Emilee Ct
- 1095 Emilee Ct
- 1304 Garden Club Dr
- 1714 Coree Dr
- 1031 Skyline Pass
- 8326 Summerset Place
- 609 Fox Orchard Run
- 8408 Summerset Place
- 8323 Hunters Knoll Place
- 8318 Summerset Place
- 717 Fox Orchard Run
- 8405 Hunters Knoll Run
- 8315 Hunters Knoll Place
- 8321 Summerset Place
- 8412 Summerset Place
- 8401 Summerset Place
- 8310 Summerset Place
- 8313 Summerset Place
- 8307 Hunters Knoll Place
- 8413 Hunters Knoll Run
- 8409 Summerset Place
- 8420 Summerset Place
- 8228 Summerset Place
- 8332 Hunters Knoll Place
- 8305 Summerset Place