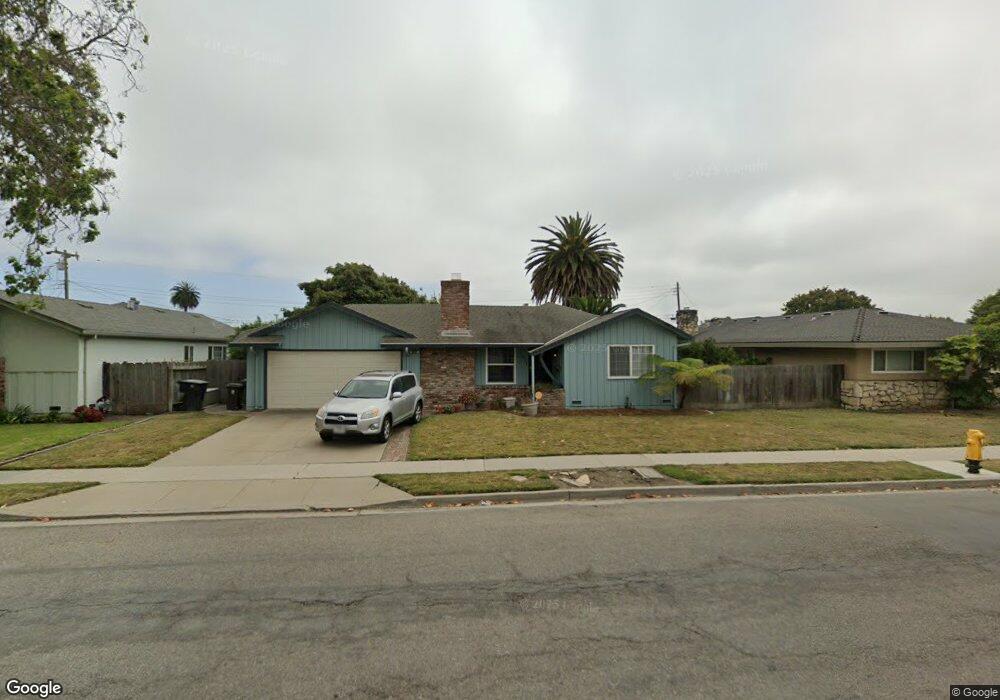
631 W Acacia St Salinas, CA 93901
South Salinas NeighborhoodEstimated Value: $773,000 - $948,000
4
Beds
3
Baths
1,994
Sq Ft
$415/Sq Ft
Est. Value
About This Home
This home is located at 631 W Acacia St, Salinas, CA 93901 and is currently estimated at $826,886, approximately $414 per square foot. 631 W Acacia St is a home located in Monterey County with nearby schools including Mission Park Elementary School, University Park Elementary School, and Lincoln Elementary School.
Ownership History
Date
Name
Owned For
Owner Type
Purchase Details
Closed on
Dec 23, 2008
Sold by
Norris Susan N
Bought by
Norris Susan N and The Susan N Norris Trust
Current Estimated Value
Purchase Details
Closed on
Oct 4, 2001
Sold by
Norris Susan N and The Susan N Norris Trust
Bought by
Norris Susan Norma
Home Financials for this Owner
Home Financials are based on the most recent Mortgage that was taken out on this home.
Original Mortgage
$18,000
Interest Rate
6.87%
Mortgage Type
Stand Alone Second
Purchase Details
Closed on
Sep 17, 1998
Sold by
Norris Susan Norma
Bought by
Norris Susan N and The Susan N Norris Trust
Purchase Details
Closed on
Sep 3, 1998
Sold by
Norris Marcus Keith
Bought by
Norris Susan Norma
Purchase Details
Closed on
Nov 21, 1995
Sold by
Kafton Alan and Kafton Carol
Bought by
Norris Marcus Keith and Norris Susan Norma
Home Financials for this Owner
Home Financials are based on the most recent Mortgage that was taken out on this home.
Original Mortgage
$110,000
Interest Rate
7.38%
Purchase Details
Closed on
Jan 30, 1995
Sold by
Kafton Shirley D and The Kafton Family Trust
Bought by
Kafton Shirley D and The Kafton Family Trust
Create a Home Valuation Report for This Property
The Home Valuation Report is an in-depth analysis detailing your home's value as well as a comparison with similar homes in the area
Home Values in the Area
Average Home Value in this Area
Purchase History
| Date | Buyer | Sale Price | Title Company |
|---|---|---|---|
| Norris Susan N | -- | None Available | |
| Norris Susan Norma | -- | Chicago Title | |
| Norris Susan N | -- | -- | |
| Norris Susan N | -- | -- | |
| Norris Susan Norma | -- | -- | |
| Norris Marcus Keith | $185,000 | Chicago Title Co | |
| Kafton Shirley D | -- | -- |
Source: Public Records
Mortgage History
| Date | Status | Borrower | Loan Amount |
|---|---|---|---|
| Closed | Norris Susan Norma | $18,000 | |
| Previous Owner | Norris Marcus Keith | $110,000 |
Source: Public Records
Tax History Compared to Growth
Tax History
| Year | Tax Paid | Tax Assessment Tax Assessment Total Assessment is a certain percentage of the fair market value that is determined by local assessors to be the total taxable value of land and additions on the property. | Land | Improvement |
|---|---|---|---|---|
| 2025 | $3,458 | $307,300 | $137,037 | $170,263 |
| 2024 | $3,458 | $301,275 | $134,350 | $166,925 |
| 2023 | $3,340 | $295,368 | $131,716 | $163,652 |
| 2022 | $3,213 | $289,578 | $129,134 | $160,444 |
| 2021 | $3,085 | $283,901 | $126,602 | $157,299 |
| 2020 | $2,999 | $280,991 | $125,304 | $155,687 |
| 2019 | $2,976 | $275,483 | $122,848 | $152,635 |
| 2018 | $2,936 | $270,083 | $120,440 | $149,643 |
| 2017 | $2,937 | $264,788 | $118,079 | $146,709 |
| 2016 | $2,938 | $259,597 | $115,764 | $143,833 |
| 2015 | $2,962 | $255,699 | $114,026 | $141,673 |
| 2014 | $2,763 | $250,691 | $111,793 | $138,898 |
Source: Public Records
Map
Nearby Homes
- 426 Palma Dr
- 786 Bellarmine Dr
- 807 University Ave
- 1111 Santa fe Way
- 1101 Greenwood Place
- 785 Ambrose Dr
- 844 Capistrano Dr
- 315 3151/2 Archer St
- 527 Park St
- 307 W Alisal St
- 840 Archer St
- 330 Woodside Dr Unit 104
- 1223 La Canada Way
- 929 Capistrano Dr
- 318 La Jolla Cir
- 1051 Riker St Unit 5
- 315 Archer St
- 307 De la Vina Way
- 29 Buena Vista St
- 138 Nissen Rd
- 627 W Acacia St
- 905 W Alisal St
- 632 Loma Vista Dr
- 636 Loma Vista Dr
- 623 W Acacia St
- 628 Loma Vista Dr
- 636 W Acacia St
- 913 W Alisal St
- 630 W Acacia St
- 624 Loma Vista Dr
- 619 W Acacia St
- 815 W Alisal St
- 622 W Acacia St
- 620 Loma Vista Dr
- 705 W Acacia St
- 615 W Acacia St
- 618 W Acacia St
- 627 Loma Vista Dr
- 631 Loma Vista Dr
- 811 W Alisal St