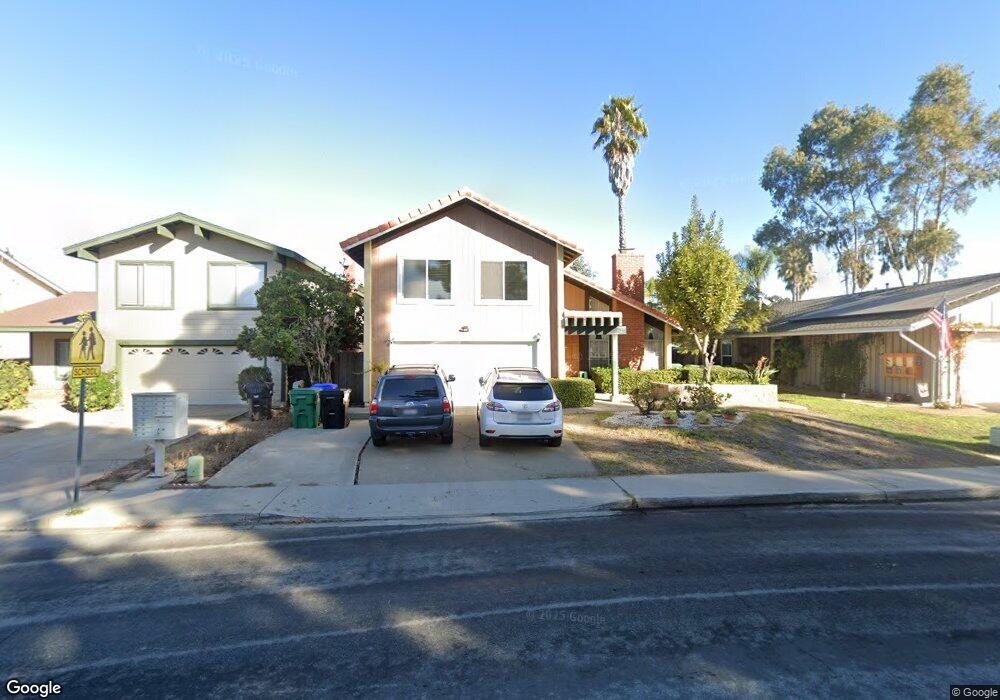
6310 Printwood Way San Diego, CA 92117
Clairemont Mesa East NeighborhoodEstimated Value: $1,210,000 - $1,353,000
4
Beds
3
Baths
1,950
Sq Ft
$645/Sq Ft
Est. Value
About This Home
This home is located at 6310 Printwood Way, San Diego, CA 92117 and is currently estimated at $1,257,410, approximately $644 per square foot. 6310 Printwood Way is a home located in San Diego County with nearby schools including Lafayette Elementary, Innovation Middle School, and Madison High School.
Ownership History
Date
Name
Owned For
Owner Type
Purchase Details
Closed on
Nov 1, 2021
Sold by
Le Loc and Hong Chan U
Bought by
Le Loc Tan and Hong Chan Uyen
Current Estimated Value
Purchase Details
Closed on
Nov 14, 2001
Sold by
Le Loc Tan and Le Vien Tan
Bought by
Le Loc Tan and Hong Chan U
Purchase Details
Closed on
Jan 26, 1998
Sold by
Le Loc Tan and Le Thuy Minh
Bought by
Le Loc Tan and Le Vien Tan
Purchase Details
Closed on
Feb 4, 1997
Sold by
Vuong Phong Quoc
Bought by
Le Thuy Minh
Home Financials for this Owner
Home Financials are based on the most recent Mortgage that was taken out on this home.
Original Mortgage
$140,600
Interest Rate
7.38%
Purchase Details
Closed on
Jan 29, 1997
Sold by
Tennant James O and Tennant Alberta J
Bought by
Le Loc Tan and Le Thuy Minh
Home Financials for this Owner
Home Financials are based on the most recent Mortgage that was taken out on this home.
Original Mortgage
$140,600
Interest Rate
7.38%
Create a Home Valuation Report for This Property
The Home Valuation Report is an in-depth analysis detailing your home's value as well as a comparison with similar homes in the area
Home Values in the Area
Average Home Value in this Area
Purchase History
| Date | Buyer | Sale Price | Title Company |
|---|---|---|---|
| Le Loc Tan | -- | None Available | |
| Le Loc Tan | -- | -- | |
| Le Loc Tan | -- | -- | |
| Le Thuy Minh | -- | Chicago Title Company | |
| Le Loc Tan | $187,500 | Chicago Title |
Source: Public Records
Mortgage History
| Date | Status | Borrower | Loan Amount |
|---|---|---|---|
| Closed | Le Loc Tan | $140,600 |
Source: Public Records
Tax History Compared to Growth
Tax History
| Year | Tax Paid | Tax Assessment Tax Assessment Total Assessment is a certain percentage of the fair market value that is determined by local assessors to be the total taxable value of land and additions on the property. | Land | Improvement |
|---|---|---|---|---|
| 2025 | $5,164 | $425,950 | $221,756 | $204,194 |
| 2024 | $5,164 | $417,599 | $217,408 | $200,191 |
| 2023 | $5,049 | $409,412 | $213,146 | $196,266 |
| 2022 | $4,915 | $401,385 | $208,967 | $192,418 |
| 2021 | $4,882 | $393,516 | $204,870 | $188,646 |
| 2020 | $4,823 | $389,482 | $202,770 | $186,712 |
| 2019 | $4,737 | $381,846 | $198,795 | $183,051 |
| 2018 | $4,430 | $374,360 | $194,898 | $179,462 |
| 2017 | $4,324 | $367,021 | $191,077 | $175,944 |
| 2016 | $4,255 | $359,826 | $187,331 | $172,495 |
| 2015 | $4,193 | $354,422 | $184,518 | $169,904 |
| 2014 | $4,127 | $347,480 | $180,904 | $166,576 |
Source: Public Records
Map
Nearby Homes
- 5656 Chandler Dr
- 5768 Camber Dr
- 5715 Castleton Dr
- 5783 Camber Dr
- 4410 Charger Blvd
- 6939 Bettyhill Dr
- 4261 Cannington Dr
- 6750 Beadnell Way Unit 3
- 6602 Beadnell Way Unit 13
- 6666 Beadnell Way Unit 9
- 6666 Beadnell Way Unit 15
- 6460 Convoy Ct Unit SPC 59
- 6460 Convoy Ct Unit 185
- 6460 Convoy Ct Unit SPC 318
- 6333 Mount Ada Rd Unit 278
- 6333 Mount Ada Rd Unit 258
- 6333 Mount Ada Rd Unit 156
- 6333 Mount Ada Rd Unit 183
- 5404 Balboa Arms Dr Unit 461
- 5402 Balboa Arms Dr Unit 345
- 6290 Printwood Way
- 6330 Printwood Way
- 6307 Hannon Ct
- 6270 Printwood Way
- 6297 Hannon Ct
- 6321 Hannon Ct
- 6289 Hannon Ct
- 6250 Printwood Way
- 4705 Cannington Dr
- 6281 Hannon Ct
- 6335 Hannon Ct
- 6230 Printwood Way
- 6370 Printwood Way
- 6351 Printwood Way
- 6349 Hannon Ct
- 6304 Hannon Ct
- 6271 Hannon Ct
- 6318 Hannon Ct
- 6270 Hannon Ct
- 6390 Printwood Way