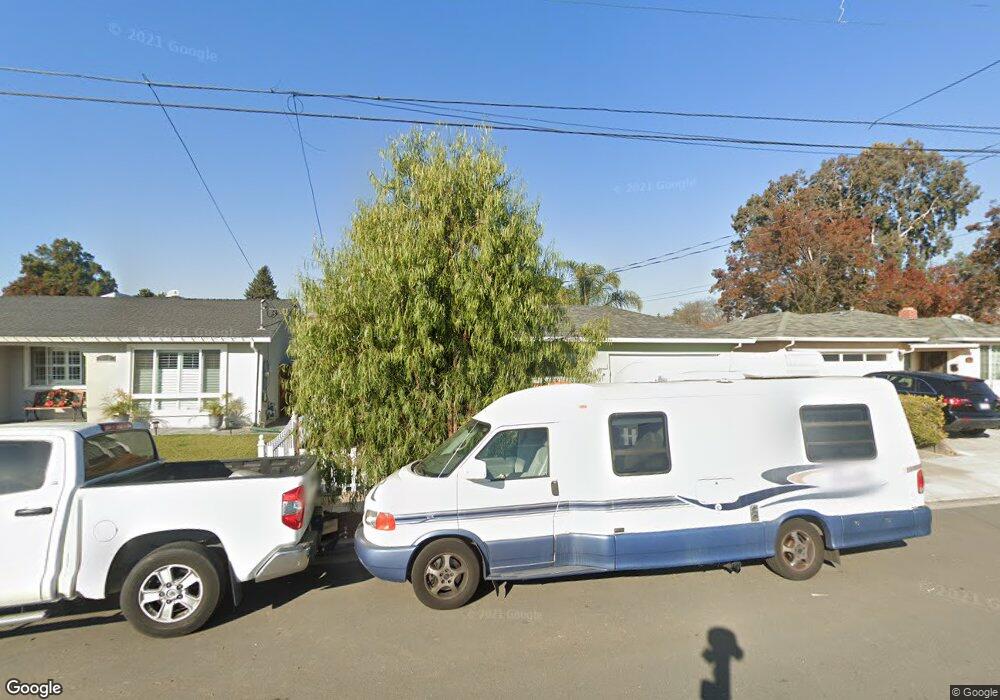
6317 Broadway Ave Newark, CA 94560
Estimated Value: $979,544 - $1,031,000
3
Beds
2
Baths
1,054
Sq Ft
$948/Sq Ft
Est. Value
About This Home
This home is located at 6317 Broadway Ave, Newark, CA 94560 and is currently estimated at $998,886, approximately $947 per square foot. 6317 Broadway Ave is a home located in Alameda County with nearby schools including Birch Grove Intermediate School, Newark Junior High School, and Newark Memorial High School.
Ownership History
Date
Name
Owned For
Owner Type
Purchase Details
Closed on
Dec 22, 2011
Sold by
Bryan Diane
Bought by
Bryan Diane
Current Estimated Value
Home Financials for this Owner
Home Financials are based on the most recent Mortgage that was taken out on this home.
Original Mortgage
$217,000
Outstanding Balance
$147,943
Interest Rate
3.94%
Mortgage Type
New Conventional
Estimated Equity
$850,943
Purchase Details
Closed on
Apr 22, 2009
Sold by
Bryan Kevin
Bought by
Bryan Diane
Home Financials for this Owner
Home Financials are based on the most recent Mortgage that was taken out on this home.
Original Mortgage
$225,000
Interest Rate
4.99%
Mortgage Type
New Conventional
Purchase Details
Closed on
Jul 21, 1998
Sold by
Henry Kenneth D and Henry Sharrie L
Bought by
Bryan Kevin and Bryan Diane
Home Financials for this Owner
Home Financials are based on the most recent Mortgage that was taken out on this home.
Original Mortgage
$214,700
Interest Rate
6.9%
Create a Home Valuation Report for This Property
The Home Valuation Report is an in-depth analysis detailing your home's value as well as a comparison with similar homes in the area
Home Values in the Area
Average Home Value in this Area
Purchase History
| Date | Buyer | Sale Price | Title Company |
|---|---|---|---|
| Bryan Diane | -- | First American Title Company | |
| Bryan Diane | -- | North American Title Company | |
| Bryan Kevin | $226,000 | American Title Co |
Source: Public Records
Mortgage History
| Date | Status | Borrower | Loan Amount |
|---|---|---|---|
| Open | Bryan Diane | $217,000 | |
| Closed | Bryan Diane | $225,000 | |
| Closed | Bryan Kevin | $214,700 |
Source: Public Records
Tax History Compared to Growth
Tax History
| Year | Tax Paid | Tax Assessment Tax Assessment Total Assessment is a certain percentage of the fair market value that is determined by local assessors to be the total taxable value of land and additions on the property. | Land | Improvement |
|---|---|---|---|---|
| 2025 | $4,682 | $347,281 | $106,284 | $247,997 |
| 2024 | $4,682 | $340,336 | $104,201 | $243,135 |
| 2023 | $4,542 | $340,527 | $102,158 | $238,369 |
| 2022 | $4,467 | $326,851 | $100,155 | $233,696 |
| 2021 | $4,358 | $320,306 | $98,192 | $229,114 |
| 2020 | $4,253 | $323,950 | $97,185 | $226,765 |
| 2019 | $4,194 | $317,600 | $95,280 | $222,320 |
| 2018 | $4,127 | $311,373 | $93,412 | $217,961 |
| 2017 | $4,021 | $305,268 | $91,580 | $213,688 |
| 2016 | $3,969 | $299,284 | $89,785 | $209,499 |
| 2015 | $3,954 | $294,788 | $88,436 | $206,352 |
| 2014 | $3,842 | $289,014 | $86,704 | $202,310 |
Source: Public Records
Map
Nearby Homes
- 6176 Thomas Ave
- 37643 Crocus Ct
- 6198 Civic Terrace Ave Unit A
- 37088 Arden St
- 6429 Robertson Ave
- 6065 Robertson Ave
- 37136 Magnolia St
- 6433 Thornton Ave
- 36976 Mulberry St
- 6153 Thornton Ave Unit D
- 6364 Noel Ave
- 5669 Civic Terrace Ave
- 36593 Leone St
- 36630 Hafner St
- 36701 Olive St
- 37659 Granville Dr
- 36523 Cherry St
- 36535 Mulberry St
- 5965 Moores Ave
- Sierra Plan at Marabel
- 6331 Broadway Ave
- 6303 Broadway Ave
- 6345 Broadway Ave
- 6316 Thomas Ave
- 6328 Thomas Ave Unit , suite, flo
- 6328 Thomas Ave
- 37425 California St
- 6340 Thomas Ave
- 6359 Broadway Ave
- 6281 Broadway Ave
- 6318 Broadway Ave
- 6332 Broadway Ave
- 6304 Broadway Ave
- 6352 Thomas Ave
- 6286 Thomas Ave
- 6346 Broadway Ave
- 6373 Broadway Ave
- 6290 Broadway Ave
- 6360 Broadway Ave
- 6273 Broadway Ave