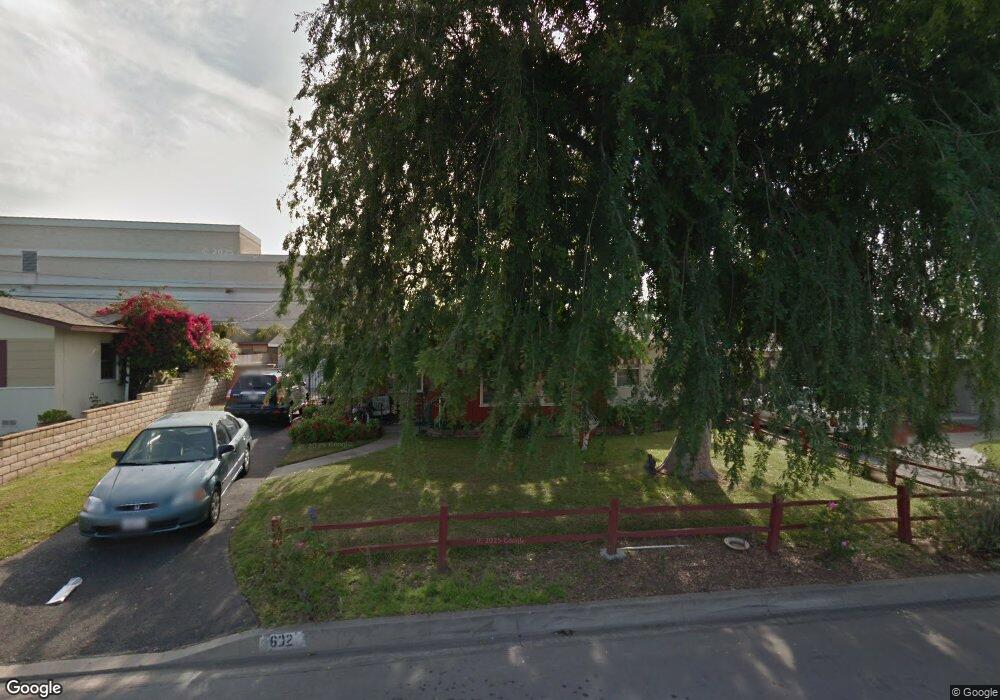
632 Brightview Dr Glendora, CA 91740
South Glendora NeighborhoodEstimated Value: $738,000 - $791,000
3
Beds
2
Baths
1,094
Sq Ft
$701/Sq Ft
Est. Value
About This Home
This home is located at 632 Brightview Dr, Glendora, CA 91740 and is currently estimated at $766,517, approximately $700 per square foot. 632 Brightview Dr is a home located in Los Angeles County with nearby schools including Stanton Elementary School, Sandburg Middle School, and Glendora High School.
Ownership History
Date
Name
Owned For
Owner Type
Purchase Details
Closed on
Sep 7, 2011
Sold by
Martinez Adrienne
Bought by
Martinez Felipe
Current Estimated Value
Home Financials for this Owner
Home Financials are based on the most recent Mortgage that was taken out on this home.
Original Mortgage
$282,648
Interest Rate
3.37%
Mortgage Type
FHA
Purchase Details
Closed on
Aug 18, 2011
Sold by
Hernandez Blanca Marisol
Bought by
Martinez Salvador
Home Financials for this Owner
Home Financials are based on the most recent Mortgage that was taken out on this home.
Original Mortgage
$282,648
Interest Rate
3.37%
Mortgage Type
FHA
Purchase Details
Closed on
Aug 17, 2011
Sold by
Wooler Richard A and Wooler Family Trust
Bought by
Martinez Salvador and Martinez Felipe
Home Financials for this Owner
Home Financials are based on the most recent Mortgage that was taken out on this home.
Original Mortgage
$282,648
Interest Rate
3.37%
Mortgage Type
FHA
Purchase Details
Closed on
Aug 27, 2003
Sold by
Wooler Barbara
Bought by
Wooler Barbara and Wooler Family Trust
Create a Home Valuation Report for This Property
The Home Valuation Report is an in-depth analysis detailing your home's value as well as a comparison with similar homes in the area
Home Values in the Area
Average Home Value in this Area
Purchase History
| Date | Buyer | Sale Price | Title Company |
|---|---|---|---|
| Martinez Felipe | -- | North American Title Company | |
| Martinez Salvador | -- | North American Title Company | |
| Martinez Salvador | $290,000 | North American Title Company | |
| Wooler Barbara | -- | -- |
Source: Public Records
Mortgage History
| Date | Status | Borrower | Loan Amount |
|---|---|---|---|
| Previous Owner | Martinez Salvador | $282,648 |
Source: Public Records
Tax History
| Year | Tax Paid | Tax Assessment Tax Assessment Total Assessment is a certain percentage of the fair market value that is determined by local assessors to be the total taxable value of land and additions on the property. | Land | Improvement |
|---|---|---|---|---|
| 2025 | $4,458 | $364,244 | $228,973 | $135,271 |
| 2024 | $4,458 | $357,103 | $224,484 | $132,619 |
| 2023 | $4,357 | $350,102 | $220,083 | $130,019 |
| 2022 | $4,276 | $343,238 | $215,768 | $127,470 |
| 2021 | $4,203 | $336,509 | $211,538 | $124,971 |
| 2019 | $3,974 | $326,529 | $205,264 | $121,265 |
| 2018 | $3,838 | $320,128 | $201,240 | $118,888 |
| 2016 | $3,677 | $307,699 | $193,427 | $114,272 |
| 2015 | $3,593 | $303,078 | $190,522 | $112,556 |
| 2014 | $3,583 | $297,142 | $186,790 | $110,352 |
Source: Public Records
Map
Nearby Homes
- 748 Brightview Dr
- 863 Delay Ave
- 422 W Route 66 Unit 87
- 19003 E Haltern Ave
- 1630 41 S Barranca Avenue Spc 41
- 811 Bridwell St
- 339 W Mauna Loa Ave
- 337 W Route 66 Unit 58
- 702 W Carroll Ave
- 1039 Brightview Dr
- 603 Lochleven St
- 6003 N Briargate Ln
- 205 W Linfield St
- 623 W Foothill Blvd Unit 39
- 619 W Foothill Blvd Unit 53
- 543 W Foothill Blvd Unit 120
- 649 W Foothill Blvd Unit 2
- 18640 E Mauna Loa Ave
- 605 W Gaillard St
- 6014 N Fairvale Dr
- 702 Brightview Dr
- 628 Brightview Dr
- 708 Brightview Dr
- 624 Brightview Dr
- 633 Brightview Dr
- 703 Brightview Dr
- 629 Brightview Dr
- 714 Brightview Dr
- 709 Brightview Dr
- 625 Brightview Dr
- 715 Brightview Dr
- 720 Brightview Dr
- 632 Forestdale Ave
- 702 Forestdale Ave
- 721 Brightview Dr
- 611 W Bagnall St
- 628 Forestdale Ave
- 615 W Bagnall St
- 708 Forestdale Ave
- 619 W Bagnall St
Your Personal Tour Guide
Ask me questions while you tour the home.