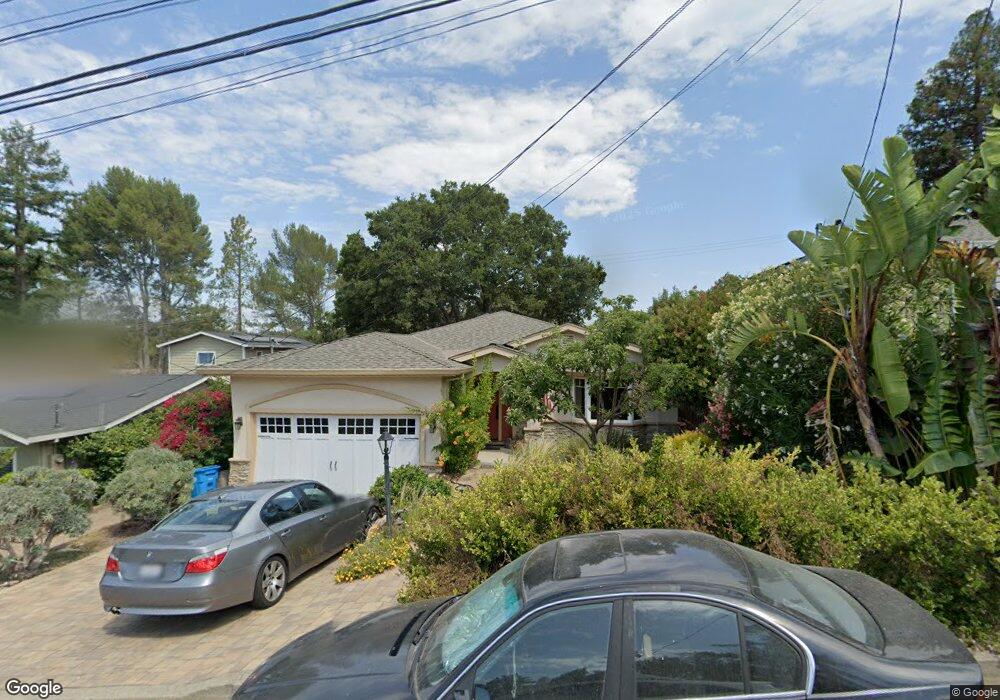
632 Dartmouth Ave San Carlos, CA 94070
Cordes NeighborhoodEstimated Value: $2,282,000 - $2,809,000
3
Beds
2
Baths
2,100
Sq Ft
$1,239/Sq Ft
Est. Value
About This Home
This home is located at 632 Dartmouth Ave, San Carlos, CA 94070 and is currently estimated at $2,601,009, approximately $1,238 per square foot. 632 Dartmouth Ave is a home located in San Mateo County with nearby schools including Arundel Elementary School, Tierra Linda Middle School, and Carlmont High School.
Ownership History
Date
Name
Owned For
Owner Type
Purchase Details
Closed on
Aug 24, 2021
Sold by
Lakshman Thiruvillamalal and Bignoli Celsina
Bought by
Bignoli Lakshman T and Bignoli Celsina
Current Estimated Value
Home Financials for this Owner
Home Financials are based on the most recent Mortgage that was taken out on this home.
Original Mortgage
$314,502
Outstanding Balance
$238,443
Interest Rate
2.1%
Mortgage Type
New Conventional
Estimated Equity
$2,362,566
Purchase Details
Closed on
Mar 31, 2006
Sold by
Lakshman T K and Bignoli Celsina
Bought by
Lakshman T K and Bignoli Celsina
Purchase Details
Closed on
Apr 2, 1999
Sold by
Sanchez John A
Bought by
Lakshman T K and Bignoli Celsina
Home Financials for this Owner
Home Financials are based on the most recent Mortgage that was taken out on this home.
Original Mortgage
$385,200
Interest Rate
6.62%
Create a Home Valuation Report for This Property
The Home Valuation Report is an in-depth analysis detailing your home's value as well as a comparison with similar homes in the area
Home Values in the Area
Average Home Value in this Area
Purchase History
| Date | Buyer | Sale Price | Title Company |
|---|---|---|---|
| Bignoli Lakshman T | -- | Mortgage Connect | |
| Lakshman Thiruvillamalai | -- | Mortgage Connect Lp | |
| Lakshman T K | -- | None Available | |
| Lakshman T K | $481,500 | Old Republic Title Ins Compa |
Source: Public Records
Mortgage History
| Date | Status | Borrower | Loan Amount |
|---|---|---|---|
| Open | Lakshman Thiruvillamalai | $314,502 | |
| Closed | Lakshman T K | $385,200 |
Source: Public Records
Tax History Compared to Growth
Tax History
| Year | Tax Paid | Tax Assessment Tax Assessment Total Assessment is a certain percentage of the fair market value that is determined by local assessors to be the total taxable value of land and additions on the property. | Land | Improvement |
|---|---|---|---|---|
| 2025 | $12,892 | $1,005,613 | $377,418 | $628,195 |
| 2023 | $12,892 | $966,567 | $362,763 | $603,804 |
| 2022 | $12,140 | $947,616 | $355,650 | $591,966 |
| 2021 | $11,962 | $929,037 | $348,677 | $580,360 |
| 2020 | $11,902 | $919,512 | $345,102 | $574,410 |
| 2019 | $11,678 | $901,484 | $338,336 | $563,148 |
| 2018 | $11,370 | $883,809 | $331,702 | $552,107 |
| 2017 | $11,218 | $866,481 | $325,199 | $541,282 |
| 2016 | $10,979 | $849,493 | $318,823 | $530,670 |
| 2015 | $10,943 | $836,734 | $314,034 | $522,700 |
| 2014 | $10,611 | $820,345 | $307,883 | $512,462 |
Source: Public Records
Map
Nearby Homes
- 46 Arch Ln
- 1220 Chula Vista Dr
- 90 Gateway Ct
- 241 Shelford Ave
- 1715 El Verano Way
- 1315 Alameda de Las Pulgas
- 38 Sequoia Ct
- 140 Northam Ave
- 1630 Courtland Rd
- 28 Kirkwood Way
- 58 Hillcrest Rd
- 108 Beverly Dr
- 141 Hillcrest Rd
- 1597 Molitor Rd
- 901 Holly Rd
- 905 South Rd
- 7 Chestnut St
- 1961 Alden St
- 0 Devonshire Blvd
- 21 Highland Ave
- 638 Dartmouth Ave
- 626 Dartmouth Ave
- 644 Dartmouth Ave
- 620 Dartmouth Ave
- 650 Dartmouth Ave
- 637 Dartmouth Ave
- 643 Dartmouth Ave
- 111 Wycombe Ave
- 625 Dartmouth Ave
- 115 Wycombe Ave
- 615 Dartmouth Ave
- 656 Dartmouth Ave
- 608 Dartmouth Ave
- 631 Dartmouth Ave
- 649 Dartmouth Ave
- 663 Dartmouth Ave
- 662 Dartmouth Ave
- 678 Wellington Dr
- 668 Wellington Dr
- 585 Dartmouth Ave