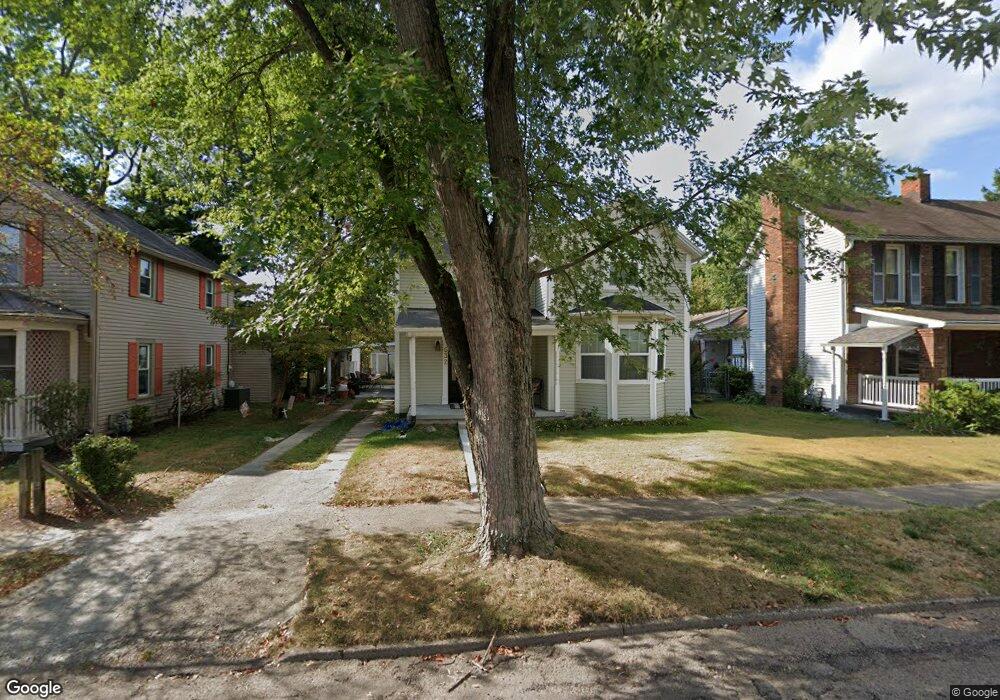
632 E Allen St Lancaster, OH 43130
Estimated Value: $193,000 - $244,000
3
Beds
1
Bath
1,626
Sq Ft
$136/Sq Ft
Est. Value
About This Home
This home is located at 632 E Allen St, Lancaster, OH 43130 and is currently estimated at $221,522, approximately $136 per square foot. 632 E Allen St is a home located in Fairfield County with nearby schools including Thomas Ewing Junior High School, Lancaster High School, and St Mary Elementary School.
Ownership History
Date
Name
Owned For
Owner Type
Purchase Details
Closed on
Feb 11, 2004
Sold by
Emc Mortgage Corp
Bought by
Hettinger Kande
Current Estimated Value
Home Financials for this Owner
Home Financials are based on the most recent Mortgage that was taken out on this home.
Original Mortgage
$55,000
Interest Rate
4.75%
Mortgage Type
Purchase Money Mortgage
Purchase Details
Closed on
Nov 19, 2003
Sold by
Golden Steven E and Golden Tracy L
Bought by
Emc Mortgage Corp
Purchase Details
Closed on
Apr 28, 1995
Sold by
Golden Sarah L
Bought by
Golden Steve E and Golden Tracy L
Home Financials for this Owner
Home Financials are based on the most recent Mortgage that was taken out on this home.
Original Mortgage
$7,000
Interest Rate
8.42%
Mortgage Type
New Conventional
Purchase Details
Closed on
Oct 21, 1993
Sold by
Standiford Sarah B
Bought by
Golden Sara Lee
Create a Home Valuation Report for This Property
The Home Valuation Report is an in-depth analysis detailing your home's value as well as a comparison with similar homes in the area
Home Values in the Area
Average Home Value in this Area
Purchase History
| Date | Buyer | Sale Price | Title Company |
|---|---|---|---|
| Hettinger Kande | $55,000 | -- | |
| Emc Mortgage Corp | $51,000 | -- | |
| Golden Steve E | $30,000 | -- | |
| Golden Sara Lee | -- | -- |
Source: Public Records
Mortgage History
| Date | Status | Borrower | Loan Amount |
|---|---|---|---|
| Previous Owner | Hettinger Kande | $55,000 | |
| Previous Owner | Golden Steve E | $7,000 |
Source: Public Records
Tax History
| Year | Tax Paid | Tax Assessment Tax Assessment Total Assessment is a certain percentage of the fair market value that is determined by local assessors to be the total taxable value of land and additions on the property. | Land | Improvement |
|---|---|---|---|---|
| 2025 | $5,112 | $81,020 | $20,430 | $60,590 |
| 2024 | $5,112 | $56,860 | $10,640 | $46,220 |
| 2023 | $2,113 | $56,860 | $10,640 | $46,220 |
| 2022 | $2,125 | $56,860 | $10,640 | $46,220 |
| 2021 | $1,863 | $46,720 | $10,640 | $36,080 |
| 2020 | $1,787 | $46,720 | $10,640 | $36,080 |
| 2019 | $1,701 | $46,720 | $10,640 | $36,080 |
| 2018 | $1,284 | $36,580 | $10,640 | $25,940 |
| 2017 | $1,284 | $33,470 | $10,020 | $23,450 |
| 2016 | $1,252 | $33,470 | $10,020 | $23,450 |
| 2015 | $1,256 | $32,600 | $10,020 | $22,580 |
| 2014 | $1,198 | $32,600 | $10,020 | $22,580 |
| 2013 | $1,198 | $32,600 | $10,020 | $22,580 |
Source: Public Records
Map
Nearby Homes
- 705 Madison Ave
- 736 E Allen St
- 641 King St
- 632 N Eastwood Ave
- 517 N Maple St
- 621 E Mulberry St
- 311 E Allen St
- 233 E 6th Ave
- 1006 King St
- 627 Harding Ave
- 600 N High St
- 534 E Wheeling St
- 869 E Mulberry St
- 545 E Main St
- 867 E Wheeling St
- 844 E Wheeling St
- 165 Lake St
- 249 N Pearl Ave
- 627 Sheridan Dr
- 846 E Main St
Your Personal Tour Guide
Ask me questions while you tour the home.