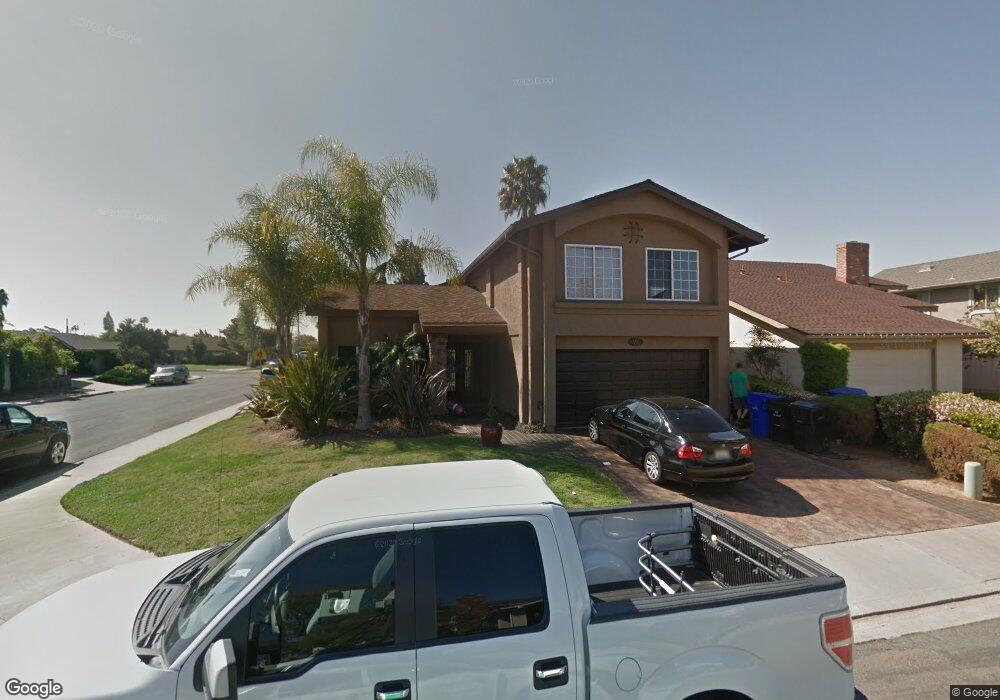
6321 Hannon Ct San Diego, CA 92117
Clairemont Mesa East NeighborhoodEstimated Value: $1,223,000 - $1,375,000
4
Beds
3
Baths
1,993
Sq Ft
$659/Sq Ft
Est. Value
About This Home
This home is located at 6321 Hannon Ct, San Diego, CA 92117 and is currently estimated at $1,313,383, approximately $658 per square foot. 6321 Hannon Ct is a home located in San Diego County with nearby schools including Lafayette Elementary, Innovation Middle School, and Madison High School.
Ownership History
Date
Name
Owned For
Owner Type
Purchase Details
Closed on
Aug 15, 2024
Sold by
Mesa Albert Vincent
Bought by
Mesa Lisa Marie
Current Estimated Value
Purchase Details
Closed on
Apr 5, 2022
Sold by
Marie Mesa Lisa
Bought by
Mesa Albert Vincent and Mesa Lisa Marie
Purchase Details
Closed on
Oct 4, 2021
Sold by
Willard John E
Bought by
Willard Lisa M
Purchase Details
Closed on
Apr 5, 2005
Sold by
Hanger Steven L and Hanger Laurie L
Bought by
Willard John E and Willard Lisa M
Home Financials for this Owner
Home Financials are based on the most recent Mortgage that was taken out on this home.
Original Mortgage
$524,000
Interest Rate
5.99%
Mortgage Type
Fannie Mae Freddie Mac
Purchase Details
Closed on
Aug 2, 2001
Sold by
Hanger Wilbur L and Hanger Betty E
Bought by
The Wilbur L & Betty E Hanger Living Tr
Purchase Details
Closed on
Aug 9, 1995
Sold by
Hanger Lori J
Bought by
Hanger Steven L
Create a Home Valuation Report for This Property
The Home Valuation Report is an in-depth analysis detailing your home's value as well as a comparison with similar homes in the area
Home Values in the Area
Average Home Value in this Area
Purchase History
| Date | Buyer | Sale Price | Title Company |
|---|---|---|---|
| Mesa Lisa Marie | -- | None Listed On Document | |
| Mesa Albert Vincent | -- | None Listed On Document | |
| Willard Lisa M | -- | Landamerica Southland Title | |
| Willard John E | $655,000 | Southland Title | |
| The Wilbur L & Betty E Hanger Living Tr | -- | -- | |
| Hanger Steven L | -- | American Title Ins Co |
Source: Public Records
Mortgage History
| Date | Status | Borrower | Loan Amount |
|---|---|---|---|
| Previous Owner | Willard John E | $524,000 |
Source: Public Records
Tax History Compared to Growth
Tax History
| Year | Tax Paid | Tax Assessment Tax Assessment Total Assessment is a certain percentage of the fair market value that is determined by local assessors to be the total taxable value of land and additions on the property. | Land | Improvement |
|---|---|---|---|---|
| 2025 | $11,126 | $928,300 | $592,403 | $335,897 |
| 2024 | $11,126 | $910,099 | $580,788 | $329,311 |
| 2023 | $10,879 | $892,254 | $569,400 | $322,854 |
| 2022 | $10,588 | $857,609 | $547,291 | $310,318 |
| 2021 | $10,514 | $857,609 | $547,291 | $310,318 |
| 2020 | $8,863 | $725,000 | $381,000 | $344,000 |
| 2019 | $8,879 | $725,000 | $381,000 | $344,000 |
| 2018 | $7,703 | $660,000 | $347,000 | $313,000 |
| 2017 | $7,611 | $655,000 | $345,000 | $310,000 |
| 2016 | $6,700 | $575,000 | $303,000 | $272,000 |
| 2015 | $6,525 | $560,000 | $296,000 | $264,000 |
| 2014 | $5,725 | $490,000 | $259,000 | $231,000 |
Source: Public Records
Map
Nearby Homes
- 5656 Chandler Dr
- 5768 Camber Dr
- 4410 Charger Blvd
- 5715 Castleton Dr
- 5783 Camber Dr
- 6939 Bettyhill Dr
- 6750 Beadnell Way Unit 3
- 4261 Cannington Dr
- 6602 Beadnell Way Unit 13
- 6666 Beadnell Way Unit 9
- 6666 Beadnell Way Unit 15
- 6460 Convoy Ct Unit SPC 59
- 6460 Convoy Ct Unit 185
- 6460 Convoy Ct Unit SPC 318
- 6333 Mount Ada Rd Unit 278
- 6333 Mount Ada Rd Unit 258
- 6333 Mount Ada Rd Unit 156
- 6333 Mount Ada Rd Unit 183
- 5404 Balboa Arms Dr Unit 461
- 5402 Balboa Arms Dr Unit 345
- 6307 Hannon Ct
- 6330 Printwood Way
- 6297 Hannon Ct
- 6335 Hannon Ct
- 6310 Printwood Way
- 4705 Cannington Dr
- 6318 Hannon Ct
- 6290 Printwood Way
- 6289 Hannon Ct
- 6304 Hannon Ct
- 6349 Hannon Ct
- 6370 Printwood Way
- 6270 Printwood Way
- 6270 Hannon Ct
- 6332 Hannon Ct
- 6363 Hannon Ct
- 4732 Cannington Dr
- 6390 Printwood Way
- 6281 Hannon Ct
- 6346 Hannon Ct