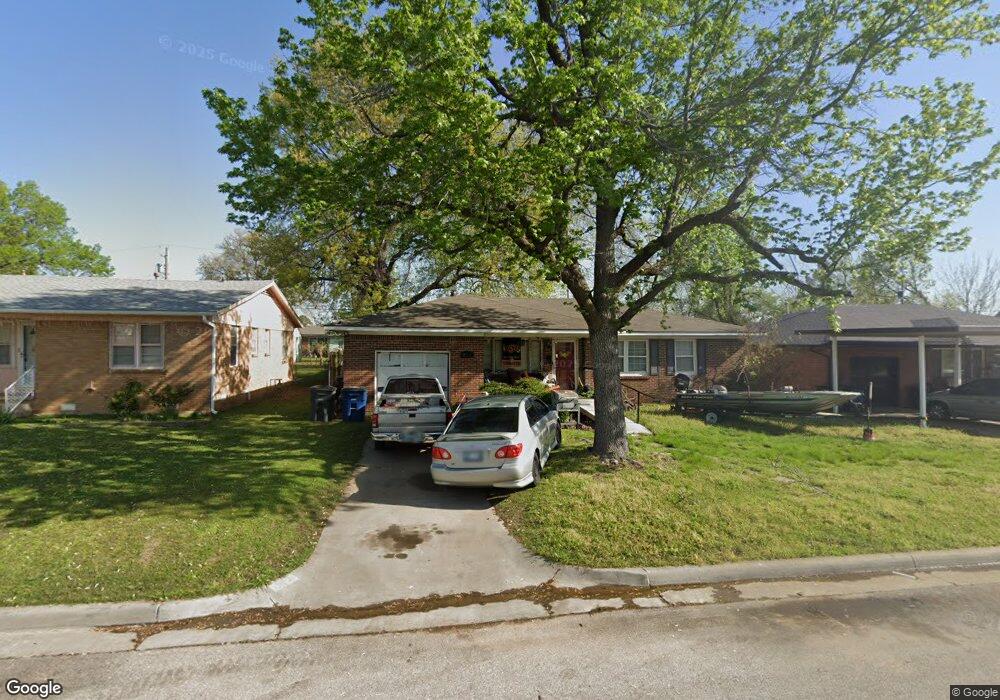
6325 E 4th St Tulsa, OK 74112
McClure Park NeighborhoodEstimated Value: $160,583 - $196,000
2
Beds
1
Bath
1,190
Sq Ft
$147/Sq Ft
Est. Value
About This Home
This home is located at 6325 E 4th St, Tulsa, OK 74112 and is currently estimated at $174,396, approximately $146 per square foot. 6325 E 4th St is a home located in Tulsa County with nearby schools including Bell Elementary School, Nathan Hale High School, and Tulsa Honor Academy Charter.
Ownership History
Date
Name
Owned For
Owner Type
Purchase Details
Closed on
Oct 5, 2009
Sold by
Dakin Sarah B
Bought by
Dakin Christopher G
Current Estimated Value
Purchase Details
Closed on
Nov 8, 2007
Sold by
Dakin Sarah B and Dakin Christopher G
Bought by
Dakin Christopher G and Dakin Sarah B
Purchase Details
Closed on
Jul 8, 2005
Sold by
Urquidez Deborah M
Bought by
Dakin Sarah B
Home Financials for this Owner
Home Financials are based on the most recent Mortgage that was taken out on this home.
Original Mortgage
$79,877
Outstanding Balance
$50,115
Interest Rate
9.3%
Mortgage Type
Fannie Mae Freddie Mac
Estimated Equity
$124,281
Purchase Details
Closed on
Aug 3, 1999
Sold by
Winecuff Henry F and Winecuff Geraldine
Bought by
Urquidez Deborah M
Home Financials for this Owner
Home Financials are based on the most recent Mortgage that was taken out on this home.
Original Mortgage
$64,767
Interest Rate
7.71%
Mortgage Type
FHA
Purchase Details
Closed on
Oct 1, 1995
Create a Home Valuation Report for This Property
The Home Valuation Report is an in-depth analysis detailing your home's value as well as a comparison with similar homes in the area
Home Values in the Area
Average Home Value in this Area
Purchase History
| Date | Buyer | Sale Price | Title Company |
|---|---|---|---|
| Dakin Christopher G | -- | None Available | |
| Dakin Christopher G | -- | Firstitle & Abstract Service | |
| Dakin Sarah B | $80,000 | Multiple | |
| Urquidez Deborah M | $65,000 | -- | |
| -- | $30,000 | -- |
Source: Public Records
Mortgage History
| Date | Status | Borrower | Loan Amount |
|---|---|---|---|
| Open | Dakin Sarah B | $79,877 | |
| Previous Owner | Urquidez Deborah M | $64,767 |
Source: Public Records
Tax History
| Year | Tax Paid | Tax Assessment Tax Assessment Total Assessment is a certain percentage of the fair market value that is determined by local assessors to be the total taxable value of land and additions on the property. | Land | Improvement |
|---|---|---|---|---|
| 2025 | $1,516 | $11,312 | $1,581 | $9,731 |
| 2024 | $1,302 | $10,772 | $1,792 | $8,980 |
| 2023 | $1,302 | $10,260 | $1,782 | $8,478 |
| 2022 | $1,303 | $9,771 | $2,206 | $7,565 |
| 2021 | $1,229 | $9,306 | $2,101 | $7,205 |
| 2020 | $1,212 | $9,306 | $2,101 | $7,205 |
| 2019 | $1,275 | $9,306 | $2,101 | $7,205 |
| 2018 | $1,278 | $9,306 | $2,101 | $7,205 |
| 2017 | $1,276 | $9,306 | $2,101 | $7,205 |
| 2016 | $1,249 | $9,306 | $2,101 | $7,205 |
| 2015 | $1,252 | $9,306 | $2,101 | $7,205 |
| 2014 | $1,240 | $9,306 | $2,101 | $7,205 |
Source: Public Records
Map
Nearby Homes
- 6329 E 4th Place
- 4307 E 4th Place
- 6316 E 5th St
- 425 S 66th East Ave
- 6115 E 4th St
- 247 S 67th East Ave
- 220 S 67th East Ave
- 5934 E 3rd St
- 424 S 69th East Ave
- 1 E 5th Place
- 106 S 67th East Ave
- 421 S 69th East Ave
- 232 S 69th East Ave
- 6736 E 6th St
- 5733 E 4th St
- 5929 E 7th St
- 725 S Lakewood Ave
- 5904 E 7th St
- 5335 E 4th Terrace
- 524 N Norwood Ave
- 6325 E 4th Terrace
- 6319 E 4th Terrace
- 6329 E 4th Terrace
- 6315 E 4th Terrace
- 6333 E 4th Terrace
- 6326 E 4th St
- 6320 E 4th St
- 6330 E 4th St
- 6316 E 4th St
- 6326 E 4th Terrace
- 6309 E 4th Terrace
- 6320 E 4th Terrace
- 6330 E 4th Terrace
- 6334 E 4th St
- 6334 E 4th Terrace
- 6342 E 4th St
- 6303 E 4th Terrace
- 6345 E 4th Terrace
- 6310 E 4th St
Your Personal Tour Guide
Ask me questions while you tour the home.