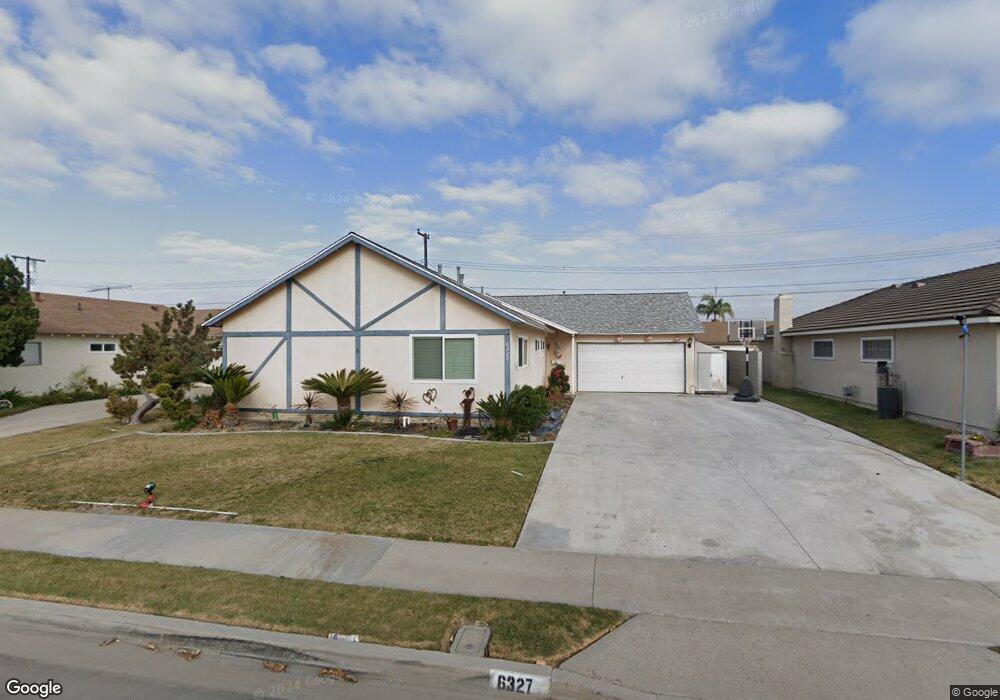
6327 Sherman Way Buena Park, CA 90620
Estimated Value: $904,278 - $965,000
4
Beds
2
Baths
1,495
Sq Ft
$629/Sq Ft
Est. Value
About This Home
This home is located at 6327 Sherman Way, Buena Park, CA 90620 and is currently estimated at $940,070, approximately $628 per square foot. 6327 Sherman Way is a home located in Orange County with nearby schools including Raymond Temple Elementary School, Walker Junior High School, and John F. Kennedy High School.
Ownership History
Date
Name
Owned For
Owner Type
Purchase Details
Closed on
Jul 28, 1998
Sold by
Vickey Maranon and Vickey Victoria
Bought by
Maranon Michael A and Maranon Sandra R
Current Estimated Value
Home Financials for this Owner
Home Financials are based on the most recent Mortgage that was taken out on this home.
Original Mortgage
$187,200
Outstanding Balance
$49,659
Interest Rate
9.99%
Estimated Equity
$890,411
Purchase Details
Closed on
Mar 11, 1994
Sold by
Maranon Vickey
Bought by
Maranon Vickey and Maranon Michael A
Purchase Details
Closed on
Jul 26, 1993
Sold by
Delbridge Maxine M
Bought by
Maranon Victoria
Home Financials for this Owner
Home Financials are based on the most recent Mortgage that was taken out on this home.
Original Mortgage
$151,200
Interest Rate
7.21%
Create a Home Valuation Report for This Property
The Home Valuation Report is an in-depth analysis detailing your home's value as well as a comparison with similar homes in the area
Home Values in the Area
Average Home Value in this Area
Purchase History
| Date | Buyer | Sale Price | Title Company |
|---|---|---|---|
| Maranon Michael A | -- | American Title Co | |
| Maranon Vickey | -- | -- | |
| Maranon Victoria | $189,000 | Gateway Title Company |
Source: Public Records
Mortgage History
| Date | Status | Borrower | Loan Amount |
|---|---|---|---|
| Open | Maranon Michael A | $187,200 | |
| Previous Owner | Maranon Victoria | $151,200 | |
| Closed | Maranon Victoria | $9,000 |
Source: Public Records
Tax History Compared to Growth
Tax History
| Year | Tax Paid | Tax Assessment Tax Assessment Total Assessment is a certain percentage of the fair market value that is determined by local assessors to be the total taxable value of land and additions on the property. | Land | Improvement |
|---|---|---|---|---|
| 2025 | $3,879 | $321,366 | $229,435 | $91,931 |
| 2024 | $3,879 | $315,065 | $224,936 | $90,129 |
| 2023 | $3,783 | $308,888 | $220,526 | $88,362 |
| 2022 | $3,733 | $302,832 | $216,202 | $86,630 |
| 2021 | $3,681 | $296,895 | $211,963 | $84,932 |
| 2020 | $6,097 | $293,851 | $209,789 | $84,062 |
| 2019 | $5,997 | $288,090 | $205,676 | $82,414 |
| 2018 | $5,933 | $282,442 | $201,643 | $80,799 |
| 2017 | $3,400 | $276,904 | $197,689 | $79,215 |
| 2016 | $3,336 | $271,475 | $193,813 | $77,662 |
| 2015 | $3,299 | $267,398 | $190,902 | $76,496 |
| 2014 | $3,137 | $262,161 | $187,163 | $74,998 |
Source: Public Records
Map
Nearby Homes
- 7571 San Rafael Dr
- 6601 Naomi Ave
- 7961 La Corona Way
- 5836 Trinidad Way
- 8011 Rose St
- 5837 Los Arcos Way
- 5686 Panama Dr
- 7531 Knott Ave
- 6996 Naomi Ave
- 8451 San Clemente Way
- 8456 San Clemente Way
- 6598 Longfellow Dr
- 7442 Susan Cir
- 5917 Crescent Ave
- 5568 Ozawa Cir
- 7650 El Vino Way
- 6932 San Diego Dr
- 7142 Orangethorpe Ave Unit 8D
- 7114 Santa Isabel Cir
- 8214 Santa Inez Way
- 6315 Sherman Way
- 6339 Sherman Way
- 6328 Mcclellan Way
- 6316 Mcclellan Way
- 6340 Mcclellan Way
- 6303 Sherman Way
- 6351 Sherman Way
- 6324 Sherman Way
- 6336 Sherman Way
- 6304 Mcclellan Way
- 6352 Mcclellan Way
- 6314 Sherman Way
- 6344 Sherman Way
- 6363 Sherman Way
- 7680 Lee Dr
- 6302 Sherman Way
- 6364 Mcclellan Way
- 6356 Sherman Way
- 6375 Sherman Way
- 6327 Mcclellan Way