633 Cooley St Springfield, MA 01128
Sixteen Acres NeighborhoodEstimated Value: $353,000 - $364,680
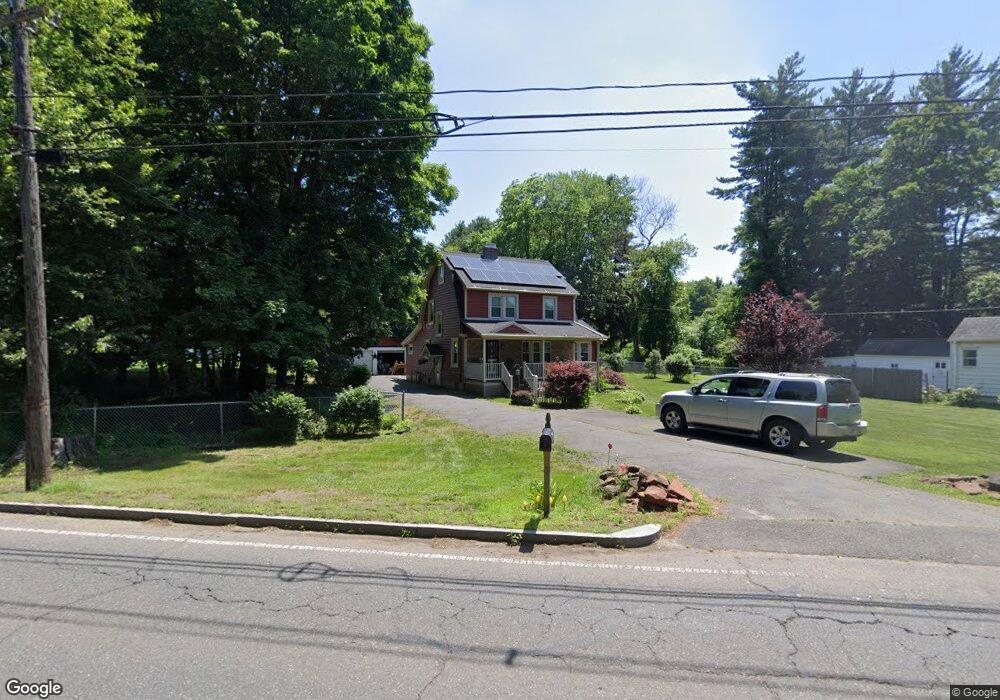
About This Home
This home is located at 633 Cooley St, Springfield, MA 01128 and is currently estimated at $358,920, approximately $225 per square foot. 633 Cooley St is a home located in Hampden County with nearby schools including Daniel B Brunton, M Marcus Kiley Middle, and Springfield High School of Science and Technology.
Ownership History
We collect this data history from publicly available records. To have your information removed, we recommend requesting removal directly through your county’s website.
Purchase Details
Purchase Details
Home Financials for this Owner
Home Financials are based on the most recent Mortgage that was taken out on this home.Home Values in the Area
Average Home Value in this Area
Purchase History
We collect this data history from publicly available records. To have your information removed, we recommend requesting removal directly through your county’s website.
| Date | Buyer | Sale Price | Title Company |
|---|---|---|---|
| -- | -- | ||
| $119,000 | -- |
Mortgage History
We collect this data history from publicly available records. To have your information removed, we recommend requesting removal directly through your county’s website.
| Date | Status | Borrower | Loan Amount |
|---|---|---|---|
| Previous Owner | $92,500 | ||
| Previous Owner | $95,000 |
Tax History
We collect this data history from publicly available records. To have your information removed, we recommend requesting removal directly through your county’s website.
| Year | Tax Paid | Tax Assessment Tax Assessment Total Assessment is a certain percentage of the fair market value that is determined by local assessors to be the total taxable value of land and additions on the property. | Land | Improvement |
|---|---|---|---|---|
| 2025 | $5,066 | $323,100 | $83,700 | $239,400 |
| 2024 | $4,828 | $300,600 | $83,700 | $216,900 |
| 2023 | $4,829 | $283,200 | $79,700 | $203,500 |
| 2022 | $4,511 | $239,700 | $79,700 | $160,000 |
| 2021 | $3,771 | $199,500 | $72,500 | $127,000 |
| 2020 | $3,519 | $180,200 | $72,500 | $107,700 |
| 2019 | $3,493 | $177,500 | $72,500 | $105,000 |
| 2018 | $3,414 | $173,500 | $72,500 | $101,000 |
| 2017 | $3,212 | $163,400 | $72,500 | $90,900 |
| 2016 | $3,065 | $155,900 | $72,500 | $83,400 |
| 2015 | $2,947 | $149,800 | $72,500 | $77,300 |
Map
- 21 Ryan Cir
- 250 Ramblewood Dr
- 331 Elm St
- 25 Pondview Dr
- 346 Newhouse St
- 2055 Allen St
- 107 Colony Dr
- 51 Briarcliff St
- 2035 Parker St
- 251 Shady Brook Ln
- 234 Mapleshade Ave
- 103 Oak Hollow Rd
- 68 Deepfield Rd
- 39 Bartels St
- 87 Squire Ln
- 84 Greenwich Rd
- 19 Somerset St
- 94 Porter Rd
- 150 Porter Rd
- 256 Mapleshade Ave
Ask me questions while you tour the home.