633 David Ct Merced, CA 95340
North Merced NeighborhoodEstimated Value: $347,656 - $410,000
3
Beds
2
Baths
1,718
Sq Ft
$228/Sq Ft
Est. Value
About This Home
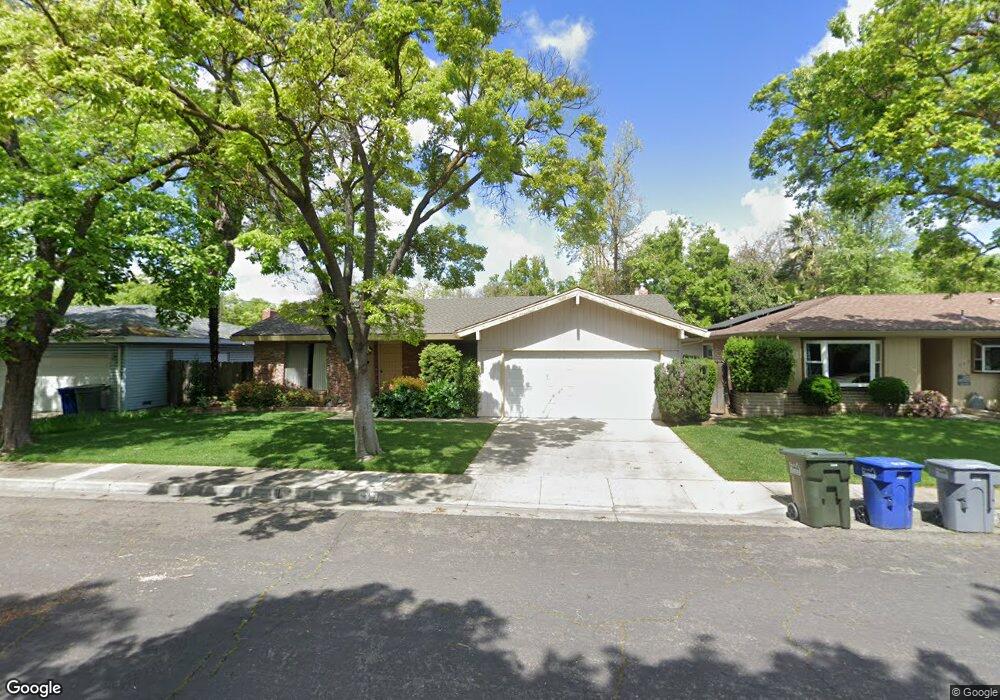
This home is located at 633 David Ct, Merced, CA 95340 and is currently estimated at $391,164, approximately $227 per square foot. 633 David Ct is a home located in Merced County with nearby schools including Luther Burbank Elementary School, Herbert Hoover Middle School, and Merced High School.
Ownership History
Date
Name
Owned For
Owner Type
Purchase Details
Closed on
Mar 7, 2016
Sold by
Matthes Maureen A and Reilly Eartha D
Bought by
Matthes Berliner Ryan A
Current Estimated Value
Purchase Details
Closed on
Dec 19, 2011
Sold by
Reilly Eartha D
Bought by
Separate Reilly Eartha D
Purchase Details
Closed on
Jul 23, 2009
Sold by
Matthes Roberta R
Bought by
Matthes Roberta R
Create a Home Valuation Report for This Property
The Home Valuation Report is an in-depth analysis detailing your home's value as well as a comparison with similar homes in the area
Home Values in the Area
Average Home Value in this Area
Purchase History
| Date | Buyer | Sale Price | Title Company |
|---|---|---|---|
| Matthes Berliner Ryan A | -- | None Available | |
| Separate Reilly Eartha D | -- | None Available | |
| Matthews Maureen A | -- | None Available | |
| Matthews Maureen A | -- | None Available | |
| Matthes Roberta R | -- | None Available |
Source: Public Records
Tax History
| Year | Tax Paid | Tax Assessment Tax Assessment Total Assessment is a certain percentage of the fair market value that is determined by local assessors to be the total taxable value of land and additions on the property. | Land | Improvement |
|---|---|---|---|---|
| 2025 | $1,022 | $96,204 | $14,520 | $81,684 |
| 2024 | $1,022 | $94,319 | $14,236 | $80,083 |
| 2023 | $1,008 | $92,470 | $13,957 | $78,513 |
| 2022 | $993 | $90,658 | $13,684 | $76,974 |
| 2021 | $991 | $88,881 | $13,416 | $75,465 |
| 2020 | $998 | $87,971 | $13,279 | $74,692 |
| 2019 | $983 | $86,247 | $13,019 | $73,228 |
| 2018 | $895 | $84,557 | $12,764 | $71,793 |
| 2017 | $929 | $82,900 | $12,514 | $70,386 |
| 2016 | $915 | $81,275 | $12,269 | $69,006 |
| 2015 | $900 | $80,055 | $12,085 | $67,970 |
| 2014 | $881 | $78,488 | $11,849 | $66,639 |
Source: Public Records
Map
Nearby Homes
- 2848 Tahoe Dr
- 688 Elise Ct
- 2819 Tenaya Dr
- 2849 Montana Ave
- 2804 Mccombs Dr
- 0 E North Bear Creek Dr
- 1 E North Bear Creek Dr
- 891 Hansen Ave
- 425 E 27th St
- 950 E South Bear Creek Dr
- 2971 Chestnut Ave
- 1056 E Alexander Ave
- 27 Emerald Dr
- 1282 Carolina Dr
- 3045 Silver Elm Ct
- 3009 Colony Park Dr
- 2720 Glen Ave
- 439 E Olive Ave
- 2709 Agnes Way
- 3125 El Capitan Ave
Your Personal Tour Guide
Ask me questions while you tour the home.