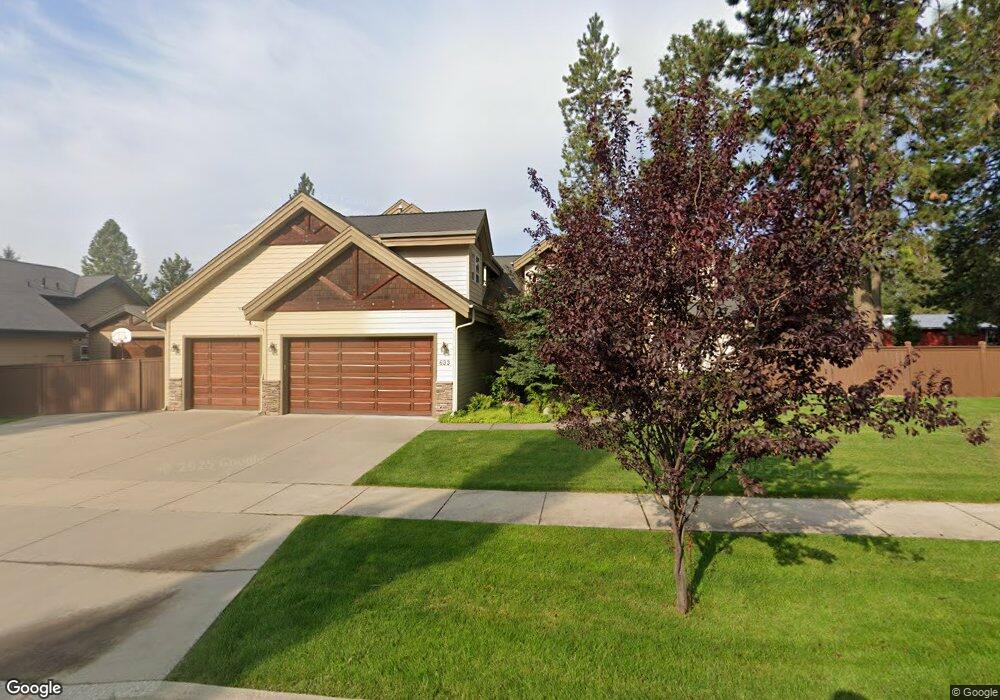
633 E Arena Loop Hayden, ID 83835
Estimated Value: $1,014,000 - $1,165,000
4
Beds
3
Baths
3,148
Sq Ft
$345/Sq Ft
Est. Value
About This Home
This home is located at 633 E Arena Loop, Hayden, ID 83835 and is currently estimated at $1,087,035, approximately $345 per square foot. 633 E Arena Loop is a home with nearby schools including Hayden Meadows Elementary School, Canfield Middle School, and Coeur d'Alene High School.
Ownership History
Date
Name
Owned For
Owner Type
Purchase Details
Closed on
Mar 26, 2020
Sold by
Craig Jessica M and Craig William A
Bought by
Troutman Jake and Troutman Ally
Current Estimated Value
Home Financials for this Owner
Home Financials are based on the most recent Mortgage that was taken out on this home.
Original Mortgage
$509,920
Outstanding Balance
$447,785
Interest Rate
3.4%
Mortgage Type
New Conventional
Estimated Equity
$639,250
Purchase Details
Closed on
Dec 21, 2011
Sold by
Callins Jessica M
Bought by
Callins Jessica M and Craig William A
Purchase Details
Closed on
Aug 4, 2005
Sold by
Smith Larry D and Smith Kathleen M
Bought by
Callins Jessica M
Home Financials for this Owner
Home Financials are based on the most recent Mortgage that was taken out on this home.
Original Mortgage
$110,000
Interest Rate
5.46%
Mortgage Type
Purchase Money Mortgage
Create a Home Valuation Report for This Property
The Home Valuation Report is an in-depth analysis detailing your home's value as well as a comparison with similar homes in the area
Purchase History
| Date | Buyer | Sale Price | Title Company |
|---|---|---|---|
| Troutman Jake | -- | Alliance Title Coeur D Alen | |
| Callins Jessica M | -- | None Available | |
| Callins Jessica M | -- | -- |
Source: Public Records
Mortgage History
| Date | Status | Borrower | Loan Amount |
|---|---|---|---|
| Open | Troutman Jake | $509,920 | |
| Previous Owner | Callins Jessica M | $110,000 |
Source: Public Records
Tax History
| Year | Tax Paid | Tax Assessment Tax Assessment Total Assessment is a certain percentage of the fair market value that is determined by local assessors to be the total taxable value of land and additions on the property. | Land | Improvement |
|---|---|---|---|---|
| 2025 | $3,838 | $1,045,384 | $250,000 | $795,384 |
| 2024 | $3,511 | $978,693 | $225,000 | $753,693 |
| 2023 | $3,511 | $941,740 | $210,000 | $731,740 |
| 2022 | $4,039 | $1,066,867 | $240,000 | $826,867 |
| 2021 | $4,208 | $728,740 | $150,000 | $578,740 |
| 2020 | $4,180 | $628,132 | $115,500 | $512,632 |
| 2019 | $4,224 | $566,310 | $105,000 | $461,310 |
| 2018 | $5,592 | $516,666 | $102,000 | $414,666 |
| 2017 | $3,999 | $487,719 | $93,600 | $394,119 |
| 2016 | $3,878 | $455,704 | $93,600 | $362,104 |
| 2015 | $3,693 | $425,367 | $78,000 | $347,367 |
| 2013 | $3,345 | $364,410 | $57,500 | $306,910 |
Source: Public Records
Map
Nearby Homes
- 11565 N Emerald Dr
- 621 E Round up Cir
- 940 E Hurricane Dr
- 11925 N Rocking r Rd
- 122 E Walrose Loop
- 1055 E Maroon Creek Dr
- 92 E Walrose Loop
- 11958 N Rocking r Rd
- 1002 E Sleeping Deer Ave
- 74 E Walrose Loop
- 11036 N Armonia Way
- 28 E Walrose Loop
- 952 E Steeple Chase Rd
- 957 E Steeple Chase Rd
- 11042 N Cattle Dr
- 1202 E Sleeping Deer Ave
- 981 E Steeple Chase Rd
- 11951 N Pinetree Rd
- 969 E Steeple Chase Rd
- 964 E Steeple Chase Rd
- 617 E Arena Loop
- 674 Arena Loop
- 645 E Arena Loop
- 626 E Arena Loop
- 11505 N Maple St
- 11475 N Maple St
- 618 E Arena Loop
- 659 E Arena Loop
- 578 E Buckles Rd
- 11514 N Emerald Dr
- 674 E Arena Loop
- 708 E Arena Loop
- 11514 N Emerald Dr
- 793 E Arena Loop
- 619 E Buckles Rd
- 673 E Arena Loop
- 13308 N Emerald Dr
- 775 E Arena Loop
- 583 E Dolomite Dr
- 11547 N Emerald Dr
Your Personal Tour Guide
Ask me questions while you tour the home.