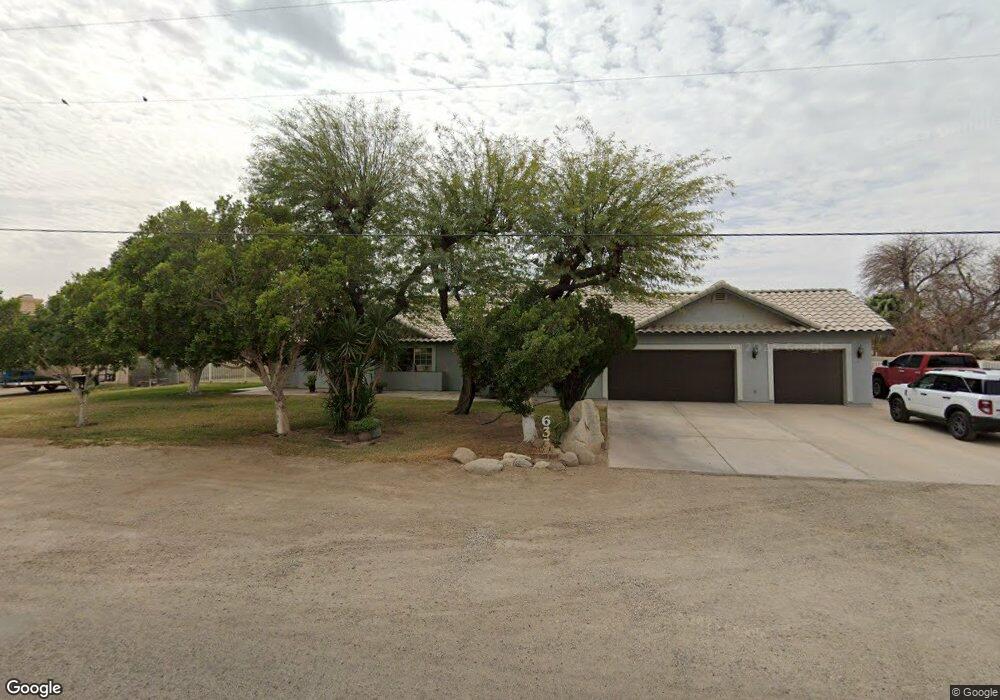
633 Hamblet Rd Imperial, CA 92251
Estimated Value: $481,940 - $624,000
3
Beds
--
Bath
1,830
Sq Ft
$312/Sq Ft
Est. Value
About This Home
This home is located at 633 Hamblet Rd, Imperial, CA 92251 and is currently estimated at $571,235, approximately $312 per square foot. 633 Hamblet Rd is a home located in Imperial County with nearby schools including Ben Hulse Elementary School, Frank M. Wright Middle School, and Imperial High School.
Ownership History
Date
Name
Owned For
Owner Type
Purchase Details
Closed on
May 26, 2021
Sold by
Sampson Don C and Hernandez Sara E
Bought by
Sampson Don C and Sampson Sara E
Current Estimated Value
Home Financials for this Owner
Home Financials are based on the most recent Mortgage that was taken out on this home.
Original Mortgage
$271,000
Outstanding Balance
$245,357
Interest Rate
2.9%
Mortgage Type
New Conventional
Estimated Equity
$325,878
Purchase Details
Closed on
Feb 19, 2014
Sold by
Mchone James E and Mchone Shirley A
Bought by
Sampson Don C and Hernandez Sara E
Home Financials for this Owner
Home Financials are based on the most recent Mortgage that was taken out on this home.
Original Mortgage
$244,897
Interest Rate
4.35%
Mortgage Type
New Conventional
Create a Home Valuation Report for This Property
The Home Valuation Report is an in-depth analysis detailing your home's value as well as a comparison with similar homes in the area
Purchase History
| Date | Buyer | Sale Price | Title Company |
|---|---|---|---|
| Sampson Don C | -- | Chicago Title Company | |
| Sampson Don C | $255,000 | Chicago Title Company |
Source: Public Records
Mortgage History
| Date | Status | Borrower | Loan Amount |
|---|---|---|---|
| Open | Sampson Don C | $271,000 | |
| Previous Owner | Sampson Don C | $244,897 |
Source: Public Records
Tax History
| Year | Tax Paid | Tax Assessment Tax Assessment Total Assessment is a certain percentage of the fair market value that is determined by local assessors to be the total taxable value of land and additions on the property. | Land | Improvement |
|---|---|---|---|---|
| 2025 | $3,285 | $294,195 | $49,029 | $245,166 |
| 2023 | $3,285 | $282,773 | $47,126 | $235,647 |
| 2022 | $3,217 | $277,229 | $46,202 | $231,027 |
| 2021 | $3,170 | $271,795 | $45,297 | $226,498 |
| 2020 | $3,138 | $269,009 | $44,833 | $224,176 |
| 2019 | $3,096 | $263,735 | $43,954 | $219,781 |
| 2018 | $3,057 | $258,565 | $43,093 | $215,472 |
| 2017 | $2,883 | $253,497 | $42,249 | $211,248 |
| 2016 | $2,781 | $248,527 | $41,421 | $207,106 |
| 2015 | $2,811 | $244,795 | $40,799 | $203,996 |
| 2014 | $1,707 | $160,000 | $36,000 | $124,000 |
Source: Public Records
Map
Nearby Homes
Your Personal Tour Guide
Ask me questions while you tour the home.