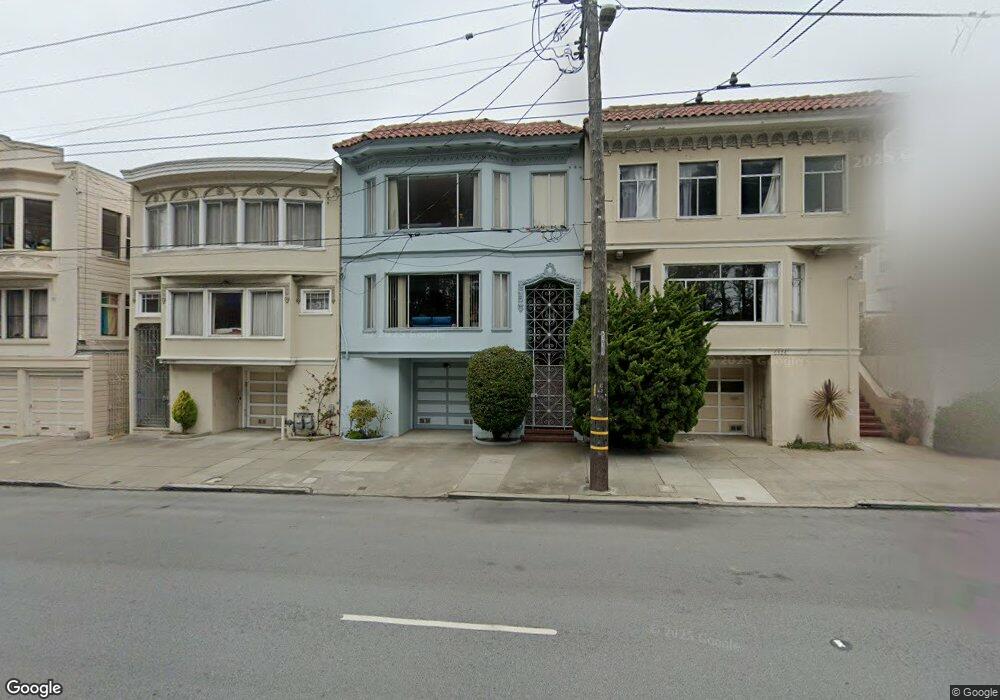
6330 Fulton St San Francisco, CA 94121
Outer Richmond NeighborhoodEstimated Value: $1,851,246 - $2,340,000
--
Bed
2
Baths
2,130
Sq Ft
$937/Sq Ft
Est. Value
About This Home
This home is located at 6330 Fulton St, San Francisco, CA 94121 and is currently estimated at $1,995,812, approximately $937 per square foot. 6330 Fulton St is a home located in San Francisco County with nearby schools including Lafayette Elementary School, Presidio Middle School, and St. Thomas The Apostle School.
Ownership History
Date
Name
Owned For
Owner Type
Purchase Details
Closed on
Nov 18, 2006
Sold by
Bondar Lana
Bought by
Bondar Aron and Bondar Riva
Current Estimated Value
Purchase Details
Closed on
Jan 27, 2006
Sold by
Bondar Aron and Bondar Riva
Bought by
Bondar Lana
Purchase Details
Closed on
Feb 14, 2005
Sold by
Bondar Aron and Bondar Riva
Bought by
Bondar Aron and Bondar Riva
Create a Home Valuation Report for This Property
The Home Valuation Report is an in-depth analysis detailing your home's value as well as a comparison with similar homes in the area
Home Values in the Area
Average Home Value in this Area
Purchase History
| Date | Buyer | Sale Price | Title Company |
|---|---|---|---|
| Bondar Aron | -- | None Available | |
| Bondar Lana | -- | None Available | |
| Bondar Aron | -- | -- |
Source: Public Records
Tax History Compared to Growth
Tax History
| Year | Tax Paid | Tax Assessment Tax Assessment Total Assessment is a certain percentage of the fair market value that is determined by local assessors to be the total taxable value of land and additions on the property. | Land | Improvement |
|---|---|---|---|---|
| 2025 | $7,503 | $650,758 | $390,462 | $260,296 |
| 2024 | $7,503 | $637,999 | $382,806 | $255,193 |
| 2023 | $7,395 | $625,490 | $375,300 | $250,190 |
| 2022 | $7,263 | $613,227 | $367,942 | $245,285 |
| 2021 | $7,137 | $601,204 | $360,728 | $240,476 |
| 2020 | $7,158 | $595,041 | $357,030 | $238,011 |
| 2019 | $6,913 | $583,375 | $350,030 | $233,345 |
| 2018 | $6,681 | $571,937 | $343,167 | $228,770 |
| 2017 | $6,602 | $560,724 | $336,439 | $224,285 |
| 2016 | $6,479 | $549,731 | $329,843 | $219,888 |
| 2015 | $6,666 | $541,475 | $324,889 | $216,586 |
| 2014 | $6,490 | $530,869 | $318,525 | $212,344 |
Source: Public Records
Map
Nearby Homes