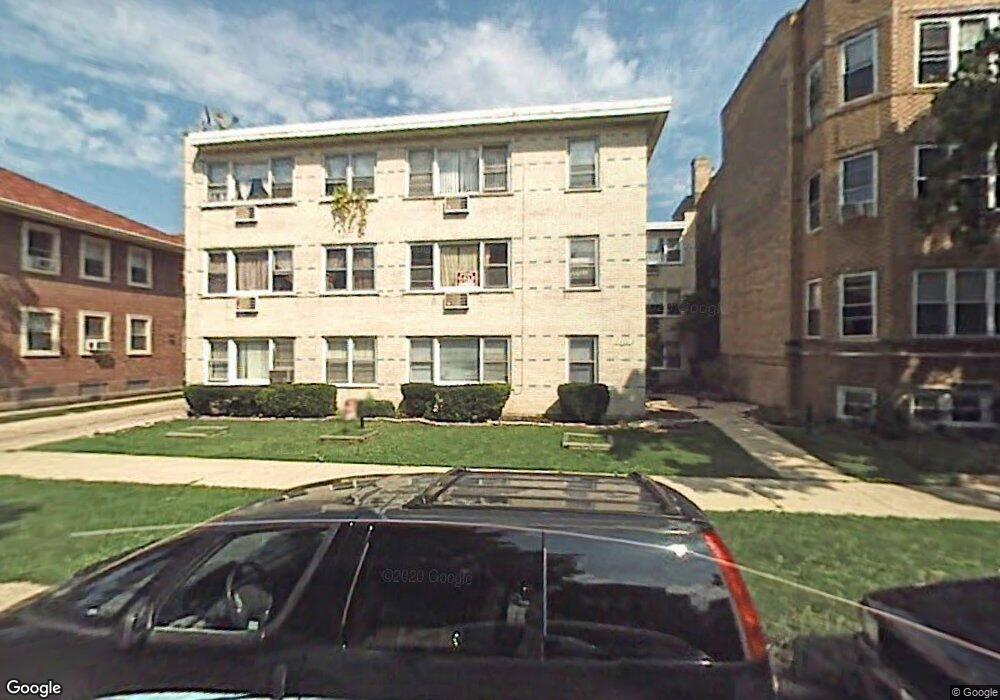
6331 N Fairfield Ave Unit 202 Chicago, IL 60659
West Ridge NeighborhoodEstimated Value: $198,000 - $228,544
3
Beds
1
Bath
10,638
Sq Ft
$20/Sq Ft
Est. Value
About This Home
This home is located at 6331 N Fairfield Ave Unit 202, Chicago, IL 60659 and is currently estimated at $214,136, approximately $20 per square foot. 6331 N Fairfield Ave Unit 202 is a home located in Cook County with nearby schools including Clinton Elementary School, Mather High School, and Yeshivas Tiferes Tzvi Academy.
Ownership History
Date
Name
Owned For
Owner Type
Purchase Details
Closed on
Aug 2, 2005
Sold by
Alvarez Noe
Bought by
Shamima Alam Gazi F and Shamima Aktark
Current Estimated Value
Purchase Details
Closed on
Jul 16, 2002
Sold by
Hussain Syed A and Hussain Nasreen
Bought by
Alvarez Noe
Home Financials for this Owner
Home Financials are based on the most recent Mortgage that was taken out on this home.
Original Mortgage
$117,200
Interest Rate
6.41%
Purchase Details
Closed on
Sep 15, 1996
Sold by
Albany Bank & Trust Company Na
Bought by
Hussain Syed A and Hussain Nasreen
Home Financials for this Owner
Home Financials are based on the most recent Mortgage that was taken out on this home.
Original Mortgage
$56,000
Interest Rate
9.24%
Purchase Details
Closed on
Apr 25, 1995
Sold by
Albany Bank & Trust Company Na
Bought by
Giannios Ekaterini
Create a Home Valuation Report for This Property
The Home Valuation Report is an in-depth analysis detailing your home's value as well as a comparison with similar homes in the area
Home Values in the Area
Average Home Value in this Area
Purchase History
| Date | Buyer | Sale Price | Title Company |
|---|---|---|---|
| Shamima Alam Gazi F | $183,000 | Pntn | |
| Alvarez Noe | $146,500 | -- | |
| Hussain Syed A | $62,000 | Mercury Title Company | |
| Giannios Ekaterini | $60,000 | Attorneys Natl Title Network |
Source: Public Records
Mortgage History
| Date | Status | Borrower | Loan Amount |
|---|---|---|---|
| Previous Owner | Alvarez Noe | $117,200 | |
| Previous Owner | Hussain Syed A | $56,000 |
Source: Public Records
Tax History Compared to Growth
Tax History
| Year | Tax Paid | Tax Assessment Tax Assessment Total Assessment is a certain percentage of the fair market value that is determined by local assessors to be the total taxable value of land and additions on the property. | Land | Improvement |
|---|---|---|---|---|
| 2024 | $2,676 | $19,580 | $3,608 | $15,972 |
| 2023 | $2,587 | $16,000 | $2,925 | $13,075 |
| 2022 | $2,587 | $16,000 | $2,925 | $13,075 |
| 2021 | $2,548 | $15,999 | $2,925 | $13,074 |
| 2020 | $1,777 | $11,080 | $1,755 | $9,325 |
| 2019 | $1,811 | $12,442 | $1,755 | $10,687 |
| 2018 | $1,779 | $12,442 | $1,755 | $10,687 |
| 2017 | $2,111 | $13,182 | $1,560 | $11,622 |
| 2016 | $2,140 | $13,182 | $1,560 | $11,622 |
| 2015 | $1,935 | $13,182 | $1,560 | $11,622 |
| 2014 | $2,107 | $13,922 | $1,462 | $12,460 |
| 2013 | $2,054 | $13,922 | $1,462 | $12,460 |
Source: Public Records
Map
Nearby Homes
- 6312 N Fairfield Ave Unit 3B
- 6307 N Talman Ave
- 6215 N Washtenaw Ave
- 6235 N Mozart St
- 6451 N California Ave Unit 2
- 6414 N Rockwell St
- 6457 N California Ave Unit 3
- 6418 N Rockwell St
- 6226 N Mozart St Unit 2N
- 6215 N Talman Ave
- 6214 N Mozart St Unit 3E
- 6439 N Rockwell St Unit 2
- 6144 N Maplewood Ave
- 6400 N Sacramento Ave Unit 205
- 6508 N Richmond St Unit 1D
- 6212 N Sacramento Ave
- 6259 N Artesian Ave
- 6319 N Artesian Ave Unit 3W
- 6539 N Sacramento Ave
- 6504 N Whipple St
- 6331 N Fairfield Ave Unit 201
- 6331 N Fairfield Ave Unit 203
- 6331 N Fairfield Ave Unit 101
- 6331 N Fairfield Ave Unit 301
- 6331 N Fairfield Ave Unit 303
- 6331 N Fairfield Ave Unit 302
- 6331 N Fairfield Ave Unit 103
- 6331 N Fairfield Ave Unit 102
- 6331 N Fairfield Ave Unit 1
- 6327 N Fairfield Ave
- 6325 N Fairfield Ave Unit 2
- 6309 N Fairfield Ave
- 6339 N Fairfield Ave
- 6323 N Fairfield Ave
- 6350 N Washtenaw Ave
- 6319 N Fairfield Ave
- 6328 N Fairfield Ave
- 6336 N Fairfield Ave
- 6338 N Fairfield Ave
- 6332 N Fairfield Ave Unit 2