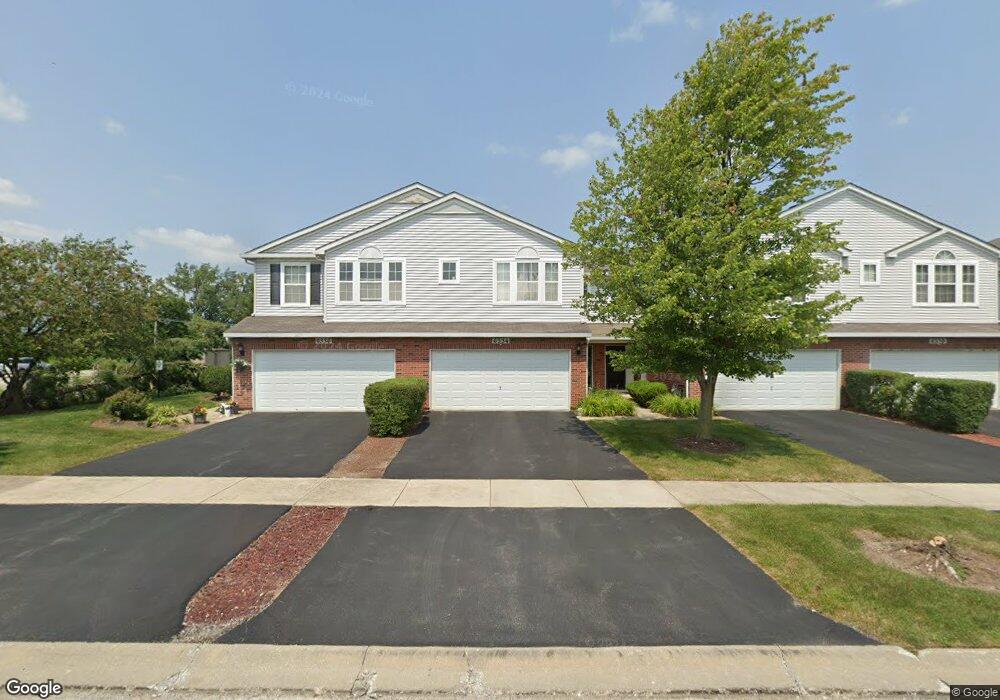
6334 Pond View Dr Unit 1142 Matteson, IL 60443
West Matteson NeighborhoodEstimated Value: $262,216 - $320,000
2
Beds
3
Baths
157,824
Sq Ft
$2/Sq Ft
Est. Value
About This Home
This home is located at 6334 Pond View Dr Unit 1142, Matteson, IL 60443 and is currently estimated at $288,554, approximately $1 per square foot. 6334 Pond View Dr Unit 1142 is a home located in Cook County with nearby schools including Colin Powell Middle School.
Ownership History
Date
Name
Owned For
Owner Type
Purchase Details
Closed on
Jan 19, 2010
Sold by
Secretary Of Housing & Urban Development
Bought by
Doss Jerry B
Current Estimated Value
Home Financials for this Owner
Home Financials are based on the most recent Mortgage that was taken out on this home.
Original Mortgage
$143,187
Interest Rate
5.5%
Mortgage Type
FHA
Purchase Details
Closed on
Jun 16, 2009
Sold by
Clark Preceise
Bought by
Secretary Of Housing & Urban Development
Purchase Details
Closed on
Mar 6, 2005
Sold by
Montalbano Builders Inc
Bought by
Clark Preceise
Home Financials for this Owner
Home Financials are based on the most recent Mortgage that was taken out on this home.
Original Mortgage
$134,656
Interest Rate
7.8%
Mortgage Type
Unknown
Create a Home Valuation Report for This Property
The Home Valuation Report is an in-depth analysis detailing your home's value as well as a comparison with similar homes in the area
Home Values in the Area
Average Home Value in this Area
Purchase History
| Date | Buyer | Sale Price | Title Company |
|---|---|---|---|
| Doss Jerry B | -- | Stewart Title Company | |
| Secretary Of Housing & Urban Development | -- | None Available | |
| Clark Preceise | $168,500 | Cti |
Source: Public Records
Mortgage History
| Date | Status | Borrower | Loan Amount |
|---|---|---|---|
| Previous Owner | Doss Jerry B | $143,187 | |
| Previous Owner | Clark Preceise | $134,656 | |
| Closed | Clark Preceise | $33,664 |
Source: Public Records
Tax History Compared to Growth
Tax History
| Year | Tax Paid | Tax Assessment Tax Assessment Total Assessment is a certain percentage of the fair market value that is determined by local assessors to be the total taxable value of land and additions on the property. | Land | Improvement |
|---|---|---|---|---|
| 2024 | $7,247 | $20,797 | $789 | $20,008 |
| 2023 | $4,019 | $20,797 | $789 | $20,008 |
| 2022 | $4,019 | $10,929 | $610 | $10,319 |
| 2021 | $4,106 | $10,927 | $609 | $10,318 |
| 2020 | $4,086 | $10,927 | $609 | $10,318 |
| 2019 | $3,182 | $9,254 | $574 | $8,680 |
| 2018 | $5,128 | $12,959 | $574 | $12,385 |
| 2017 | $5,018 | $12,959 | $574 | $12,385 |
| 2016 | $5,424 | $12,978 | $538 | $12,440 |
| 2015 | $5,262 | $12,978 | $538 | $12,440 |
| 2014 | $5,146 | $12,978 | $538 | $12,440 |
| 2013 | $5,998 | $15,668 | $538 | $15,130 |
Source: Public Records
Map
Nearby Homes
- 6216 Pond View Dr
- 21143 Gray Hawk Dr Unit 2554
- 6423 Gray Hawk Dr Unit 2716
- 1008 Willow Rd
- 6200 Marsh Ln
- 1000 Warwick Dr
- 6529 Blue Sky Ln
- 6520 Bridle Path Dr
- 6260 Sunflower Dr
- 21218 Shannon Ave
- 6125 Sunflower Dr
- 931 Destiny Dr
- 749 Old Farm Rd
- 6103 Sunflower Dr
- 0 Ridgeland Ave
- 6409 Old Plank Blvd
- 6608 Pasture Side Trail
- 6306 Beaver Dam Rd
- 6508 Fawn Ct
- 6230 Streamwood Ln
- 6336 Pond View Dr Unit 1141
- 6332 Pond View Dr Unit 1143
- 6330 Pond View Dr Unit 1144
- 6328 Pond View Dr Unit 1145
- 6326 Pond View Dr Unit 1146
- 916 Berry Path Trail Unit 1134
- 6322 Pond View Dr Unit 1152
- 918 Berry Path Trail Unit 1133
- 6320 Pond View Dr Unit 1153
- 6318 Pond View Dr Unit 1154
- 6318 Pond View Dr Unit 1038
- 920 Berry Path Trail Unit 1132
- 911 Berry Path Trail Unit 1191
- 922 Berry Path Trail Unit 1131
- 913 Berry Path Trail Unit 1192
- 6316 Pond View Dr Unit 1155
- 915 Berry Path Trail Unit 1193
- 6314 Pond View Dr Unit 1156
- 6327 Pond View Dr Unit 1205