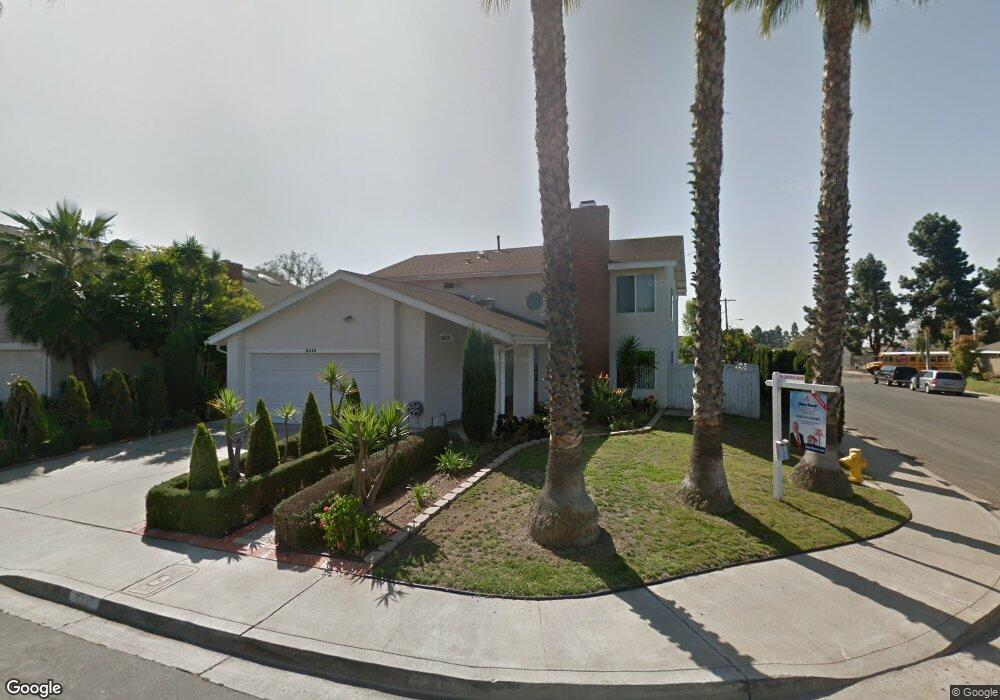
6335 Hannon Ct San Diego, CA 92117
Clairemont Mesa East NeighborhoodEstimated Value: $1,276,000 - $1,430,000
5
Beds
3
Baths
2,348
Sq Ft
$585/Sq Ft
Est. Value
About This Home
This home is located at 6335 Hannon Ct, San Diego, CA 92117 and is currently estimated at $1,374,073, approximately $585 per square foot. 6335 Hannon Ct is a home located in San Diego County with nearby schools including Lafayette Elementary, Innovation Middle School, and Madison High School.
Ownership History
Date
Name
Owned For
Owner Type
Purchase Details
Closed on
May 9, 2016
Sold by
Radovanovic Dragoslav and Radovanovic Ljiljana
Bought by
Montano Curtis and Montano Sarah
Current Estimated Value
Home Financials for this Owner
Home Financials are based on the most recent Mortgage that was taken out on this home.
Original Mortgage
$569,493
Outstanding Balance
$453,356
Interest Rate
3.66%
Mortgage Type
New Conventional
Estimated Equity
$920,717
Purchase Details
Closed on
Aug 1, 2013
Sold by
Radovanovic Dragoslav and Radovanovic Ljiljana
Bought by
Radovanovic Dragoslav and Radovanovic Ljiljana
Purchase Details
Closed on
Dec 11, 1995
Sold by
Burian Allen A and Burian Susan M
Bought by
Radovanovic Dragoslav and Radovanovic Ljiljana
Home Financials for this Owner
Home Financials are based on the most recent Mortgage that was taken out on this home.
Original Mortgage
$160,000
Interest Rate
7.05%
Purchase Details
Closed on
Dec 18, 1992
Purchase Details
Closed on
May 25, 1988
Create a Home Valuation Report for This Property
The Home Valuation Report is an in-depth analysis detailing your home's value as well as a comparison with similar homes in the area
Home Values in the Area
Average Home Value in this Area
Purchase History
| Date | Buyer | Sale Price | Title Company |
|---|---|---|---|
| Montano Curtis | $670,000 | Fidelity National Title Co | |
| Radovanovic Dragoslav | -- | None Available | |
| Radovanovic Dragoslav | $190,000 | First American Title Co | |
| -- | $240,000 | -- | |
| -- | $209,000 | -- |
Source: Public Records
Mortgage History
| Date | Status | Borrower | Loan Amount |
|---|---|---|---|
| Open | Montano Curtis | $569,493 | |
| Previous Owner | Radovanovic Dragoslav | $160,000 |
Source: Public Records
Tax History Compared to Growth
Tax History
| Year | Tax Paid | Tax Assessment Tax Assessment Total Assessment is a certain percentage of the fair market value that is determined by local assessors to be the total taxable value of land and additions on the property. | Land | Improvement |
|---|---|---|---|---|
| 2025 | $9,498 | $793,135 | $417,440 | $375,695 |
| 2024 | $9,498 | $777,584 | $409,255 | $368,329 |
| 2023 | $9,287 | $762,338 | $401,231 | $361,107 |
| 2022 | $9,039 | $747,391 | $393,364 | $354,027 |
| 2021 | $8,975 | $732,737 | $385,651 | $347,086 |
| 2020 | $8,866 | $725,225 | $381,697 | $343,528 |
| 2019 | $8,706 | $711,006 | $374,213 | $336,793 |
| 2018 | $8,138 | $697,066 | $366,876 | $330,190 |
| 2017 | $81 | $683,399 | $359,683 | $323,716 |
| 2016 | $3,078 | $266,620 | $140,326 | $126,294 |
| 2015 | $3,032 | $262,616 | $138,219 | $124,397 |
| 2014 | $2,983 | $257,473 | $135,512 | $121,961 |
Source: Public Records
Map
Nearby Homes
- 5656 Chandler Dr
- 5768 Camber Dr
- 4410 Charger Blvd
- 5715 Castleton Dr
- 5783 Camber Dr
- 6939 Bettyhill Dr
- 6750 Beadnell Way Unit 3
- 4261 Cannington Dr
- 6602 Beadnell Way Unit 13
- 6666 Beadnell Way Unit 9
- 6666 Beadnell Way Unit 15
- 6460 Convoy Ct Unit SPC 59
- 6460 Convoy Ct Unit 185
- 6460 Convoy Ct Unit SPC 318
- 6333 Mount Ada Rd Unit 278
- 6333 Mount Ada Rd Unit 258
- 6333 Mount Ada Rd Unit 156
- 6333 Mount Ada Rd Unit 183
- 5404 Balboa Arms Dr Unit 461
- 5402 Balboa Arms Dr Unit 345
- 6349 Hannon Ct
- 4705 Cannington Dr
- 6363 Hannon Ct
- 6370 Printwood Way
- 6321 Hannon Ct
- 6390 Printwood Way
- 6330 Printwood Way
- 6332 Hannon Ct
- 6377 Hannon Ct
- 6346 Hannon Ct
- 6307 Hannon Ct
- 6396 Printwood Way
- 6318 Hannon Ct
- 6310 Printwood Way
- 6410 Printwood Way
- 6297 Hannon Ct
- 6391 Hannon Ct
- 4735 Cannington Dr
- 6304 Hannon Ct
- 4732 Cannington Dr