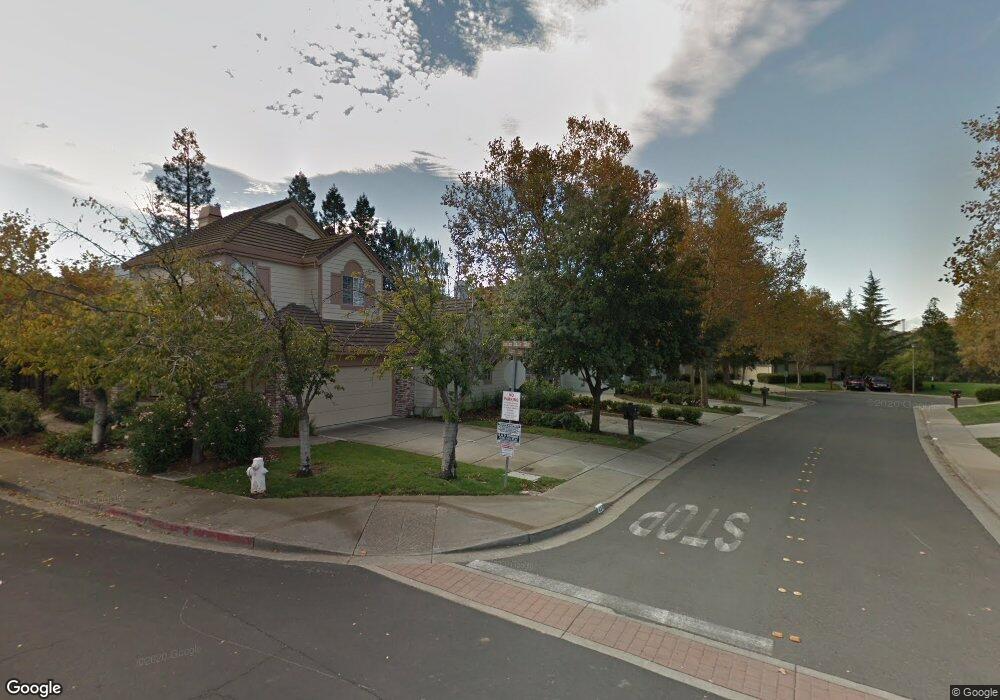
634 Julpun Loop Clayton, CA 94517
Estimated Value: $804,000 - $858,000
3
Beds
3
Baths
1,939
Sq Ft
$427/Sq Ft
Est. Value
About This Home
This home is located at 634 Julpun Loop, Clayton, CA 94517 and is currently estimated at $827,032, approximately $426 per square foot. 634 Julpun Loop is a home located in Contra Costa County with nearby schools including Mt. Diablo Elementary School, Diablo View Middle School, and College Park High School.
Ownership History
Date
Name
Owned For
Owner Type
Purchase Details
Closed on
Aug 7, 2015
Sold by
Woodworth John W and Jay Jennifer L
Bought by
Vadnais Gerald F and Ferro Kelly J
Current Estimated Value
Home Financials for this Owner
Home Financials are based on the most recent Mortgage that was taken out on this home.
Original Mortgage
$544,947
Outstanding Balance
$428,889
Interest Rate
4.05%
Mortgage Type
FHA
Estimated Equity
$398,143
Purchase Details
Closed on
Dec 15, 2008
Sold by
Woodworth John W
Bought by
Woodworth John W and Jay Jennifer L
Purchase Details
Closed on
May 23, 1994
Sold by
Brown Jack A and Bisbee Jane A
Bought by
Woodworth John W
Home Financials for this Owner
Home Financials are based on the most recent Mortgage that was taken out on this home.
Original Mortgage
$203,150
Interest Rate
5.62%
Mortgage Type
Purchase Money Mortgage
Create a Home Valuation Report for This Property
The Home Valuation Report is an in-depth analysis detailing your home's value as well as a comparison with similar homes in the area
Home Values in the Area
Average Home Value in this Area
Purchase History
| Date | Buyer | Sale Price | Title Company |
|---|---|---|---|
| Vadnais Gerald F | $555,000 | Fidelity National Title Co | |
| Woodworth John W | -- | None Available | |
| Woodworth John W | $127,500 | First American Title Co |
Source: Public Records
Mortgage History
| Date | Status | Borrower | Loan Amount |
|---|---|---|---|
| Open | Vadnais Gerald F | $544,947 | |
| Previous Owner | Woodworth John W | $203,150 |
Source: Public Records
Tax History
| Year | Tax Paid | Tax Assessment Tax Assessment Total Assessment is a certain percentage of the fair market value that is determined by local assessors to be the total taxable value of land and additions on the property. | Land | Improvement |
|---|---|---|---|---|
| 2025 | $8,724 | $656,998 | $272,269 | $384,729 |
| 2024 | $8,231 | $644,117 | $266,931 | $377,186 |
| 2023 | $8,231 | $631,489 | $261,698 | $369,791 |
| 2022 | $8,181 | $619,108 | $256,567 | $362,541 |
| 2021 | $8,028 | $606,970 | $251,537 | $355,433 |
| 2019 | $7,989 | $588,969 | $244,077 | $344,892 |
| 2018 | $7,701 | $577,422 | $239,292 | $338,130 |
| 2017 | $7,458 | $566,100 | $234,600 | $331,500 |
| 2016 | $7,265 | $555,000 | $230,000 | $325,000 |
| 2015 | $4,723 | $325,252 | $118,784 | $206,468 |
| 2014 | $4,633 | $318,882 | $116,458 | $202,424 |
Source: Public Records
Map
Nearby Homes
- 1383 Shell Ln
- 5617 Bettencourt Dr
- 5612 Frank Place
- 1048 Panadero Ct
- 1921 Eagle Peak Ave Unit 28
- 1421 Lydia Ln
- 5 Pardi Ln
- 1897 Camino Estrada
- 249 Stranahan Cir
- 1506 N El Camino Dr
- 1833 Camino Estrada
- 1394 El Camino Dr
- 5537 Pamplona Ct
- 5849 Mitchell Canyon Ct
- 376 Blue Oak Ln
- 5817 Mitchell Canyon Ct
- 5454 Anselmo Ct
- 5555 Maryland Dr
- 5565 Banff Ct
- 105 Crow Place
- 632 Julpun Loop
- 636 Julpun Loop
- 638 Julpun Loop
- 630 Julpun Loop Unit 2
- 806 Chert Place
- 804 Chert Place
- 628 Julpun Loop
- 808 Chert Place
- 802 Chert Place
- 629 Julpun Loop
- 633 Julpun Loop
- 810 Chert Place
- 625 Julpun Loop
- 800 Chert Place
- 637 Julpun Loop
- 812 Chert Place
- 624 Julpun Loop
- 502 Suisun Ct
- 501 Suisun Ct
- 1729 Indian Wells Way
Your Personal Tour Guide
Ask me questions while you tour the home.