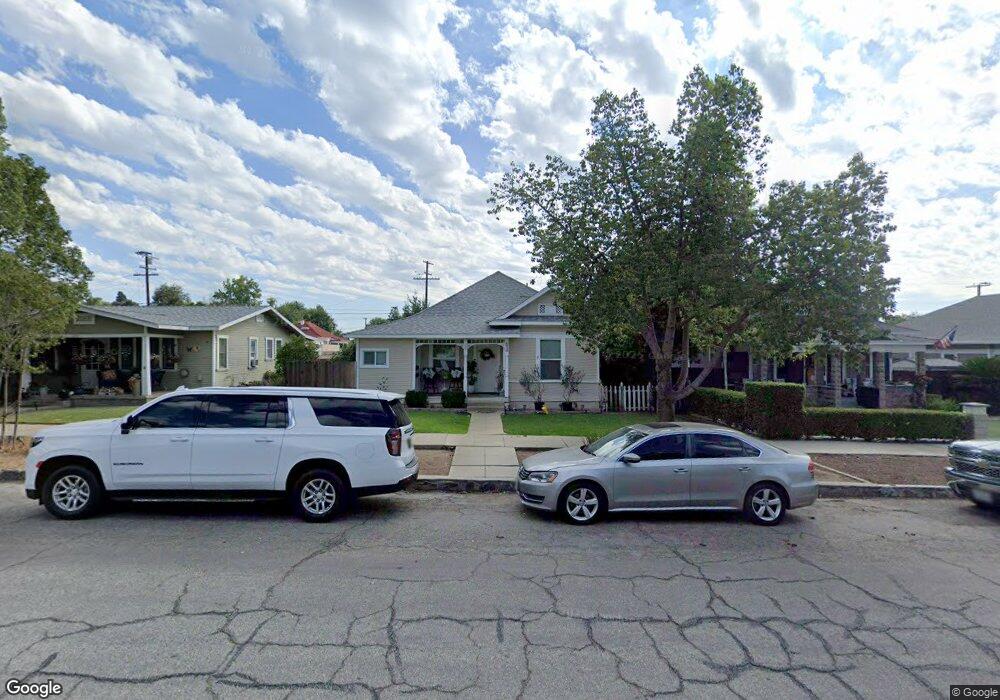
634 N 1st Ave Unit A & B Upland, CA 91786
Estimated Value: $662,000 - $798,000
5
Beds
2
Baths
2,153
Sq Ft
$330/Sq Ft
Est. Value
About This Home
This home is located at 634 N 1st Ave Unit A & B, Upland, CA 91786 and is currently estimated at $709,882, approximately $329 per square foot. 634 N 1st Ave Unit A & B is a home located in San Bernardino County with nearby schools including Upland Elementary School, Upland Junior High School, and Upland High School.
Ownership History
Date
Name
Owned For
Owner Type
Purchase Details
Closed on
Apr 10, 2013
Sold by
Us Bank National Association
Bought by
Wu Yi
Current Estimated Value
Purchase Details
Closed on
Jul 12, 2011
Sold by
Coulter Mark D
Bought by
U S Bank National Association
Purchase Details
Closed on
Apr 25, 2006
Sold by
Vellas Lawrence
Bought by
Coulter Mark D
Home Financials for this Owner
Home Financials are based on the most recent Mortgage that was taken out on this home.
Original Mortgage
$280,000
Interest Rate
8.45%
Mortgage Type
Purchase Money Mortgage
Purchase Details
Closed on
Mar 29, 2006
Sold by
Vellas Lawrence E
Bought by
Vellas Lawrence and Lawrence Vellas Living Trust
Home Financials for this Owner
Home Financials are based on the most recent Mortgage that was taken out on this home.
Original Mortgage
$280,000
Interest Rate
8.45%
Mortgage Type
Purchase Money Mortgage
Purchase Details
Closed on
Nov 26, 2002
Sold by
Vellas Lawrence E
Bought by
Vellas Lawrence E and Vellas Jason
Create a Home Valuation Report for This Property
The Home Valuation Report is an in-depth analysis detailing your home's value as well as a comparison with similar homes in the area
Home Values in the Area
Average Home Value in this Area
Purchase History
| Date | Buyer | Sale Price | Title Company |
|---|---|---|---|
| Wu Yi | $275,000 | Lawyers Title Company | |
| U S Bank National Association | $249,750 | Accommodation | |
| Coulter Mark D | $350,000 | Investors Title Company | |
| Vellas Lawrence | -- | None Available | |
| Vellas Lawrence E | -- | First American |
Source: Public Records
Mortgage History
| Date | Status | Borrower | Loan Amount |
|---|---|---|---|
| Previous Owner | Coulter Mark D | $280,000 |
Source: Public Records
Tax History
| Year | Tax Paid | Tax Assessment Tax Assessment Total Assessment is a certain percentage of the fair market value that is determined by local assessors to be the total taxable value of land and additions on the property. | Land | Improvement |
|---|---|---|---|---|
| 2025 | $4,330 | $338,643 | $116,985 | $221,658 |
| 2024 | $3,734 | $332,003 | $114,691 | $217,312 |
| 2023 | $3,677 | $325,493 | $112,442 | $213,051 |
| 2022 | $3,597 | $319,111 | $110,237 | $208,874 |
| 2021 | $3,591 | $312,853 | $108,075 | $204,778 |
| 2020 | $3,494 | $309,645 | $106,967 | $202,678 |
| 2019 | $3,483 | $303,574 | $104,870 | $198,704 |
| 2018 | $3,399 | $297,622 | $102,814 | $194,808 |
| 2017 | $3,302 | $291,786 | $100,798 | $190,988 |
| 2016 | $3,143 | $286,065 | $98,822 | $187,243 |
| 2015 | $3,021 | $281,768 | $97,338 | $184,430 |
| 2014 | $3,290 | $276,248 | $95,431 | $180,817 |
Source: Public Records
Map
Nearby Homes
- 509 N Euclid Ave
- 636 N Palm Ave
- 511 D St
- 855 N Palm Ave
- 161 N 1st Ave
- 922 N 4th Ave
- 145 N 1st Ave
- 556 D St
- 910 N Redding Way Unit I
- 910 N Redding Way Unit F
- 111 N 1st Ave
- 107 N 1st Ave
- 494 N Campus Ave
- 478 N Campus Ave
- 435 W 9th St Unit B3
- 617 N Ukiah Way
- 345 Euclid Place
- 144 Dorsett Ave
- 762 N Vallejo Way
- 595 Orlando Ct
Your Personal Tour Guide
Ask me questions while you tour the home.