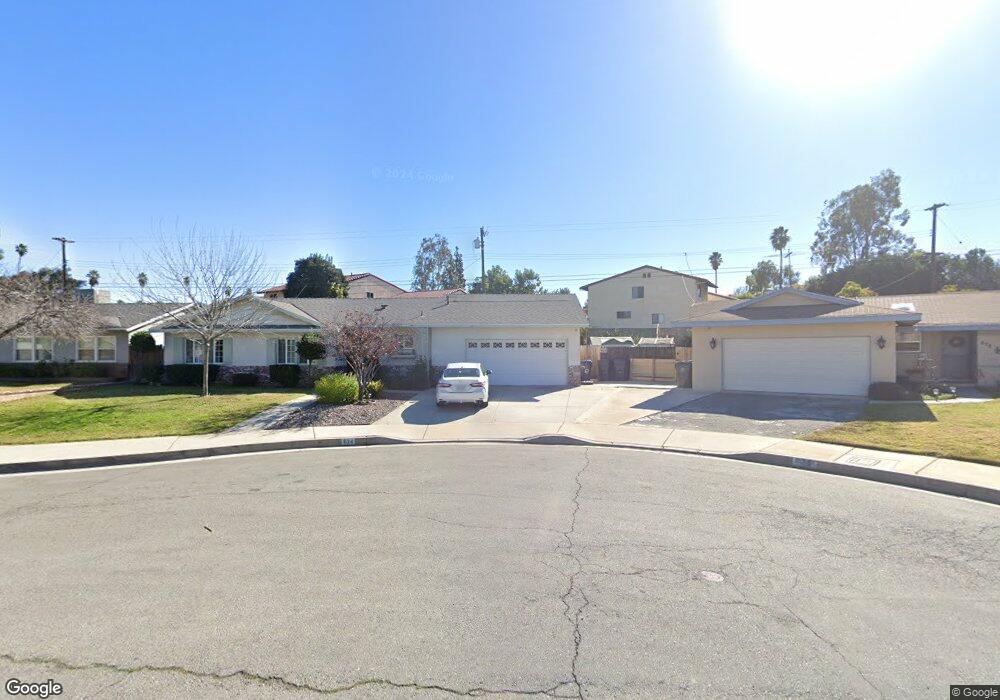
634 Orchard Dr Redlands, CA 92374
South Redlands NeighborhoodEstimated Value: $573,868 - $663,000
4
Beds
2
Baths
1,563
Sq Ft
$404/Sq Ft
Est. Value
About This Home
This home is located at 634 Orchard Dr, Redlands, CA 92374 and is currently estimated at $631,717, approximately $404 per square foot. 634 Orchard Dr is a home located in San Bernardino County with nearby schools including Kingsbury Elementary School, Moore Middle School, and Redlands Senior High School.
Ownership History
Date
Name
Owned For
Owner Type
Purchase Details
Closed on
Jul 8, 1997
Sold by
Garcia Jose L and Fenoy Carmen Tr
Bought by
Mendoza Carlos and Mendoza Lilia
Current Estimated Value
Home Financials for this Owner
Home Financials are based on the most recent Mortgage that was taken out on this home.
Original Mortgage
$77,750
Outstanding Balance
$11,558
Interest Rate
7.92%
Estimated Equity
$620,159
Create a Home Valuation Report for This Property
The Home Valuation Report is an in-depth analysis detailing your home's value as well as a comparison with similar homes in the area
Home Values in the Area
Average Home Value in this Area
Purchase History
| Date | Buyer | Sale Price | Title Company |
|---|---|---|---|
| Mendoza Carlos | $91,500 | Lawyers Title Company |
Source: Public Records
Mortgage History
| Date | Status | Borrower | Loan Amount |
|---|---|---|---|
| Open | Mendoza Carlos | $77,750 |
Source: Public Records
Tax History
| Year | Tax Paid | Tax Assessment Tax Assessment Total Assessment is a certain percentage of the fair market value that is determined by local assessors to be the total taxable value of land and additions on the property. | Land | Improvement |
|---|---|---|---|---|
| 2025 | $2,332 | $185,221 | $55,885 | $129,336 |
| 2024 | $2,179 | $181,589 | $54,789 | $126,800 |
| 2023 | $2,176 | $178,029 | $53,715 | $124,314 |
| 2022 | $2,145 | $174,538 | $52,662 | $121,876 |
| 2021 | $2,184 | $171,115 | $51,629 | $119,486 |
| 2020 | $2,152 | $169,361 | $51,100 | $118,261 |
| 2019 | $2,092 | $166,040 | $50,098 | $115,942 |
| 2018 | $2,041 | $162,785 | $49,116 | $113,669 |
| 2017 | $2,024 | $159,593 | $48,153 | $111,440 |
| 2016 | $2,001 | $156,464 | $47,209 | $109,255 |
| 2015 | $1,987 | $154,114 | $46,500 | $107,614 |
| 2014 | $1,951 | $151,095 | $45,589 | $105,506 |
Source: Public Records
Map
Nearby Homes
- 635 E Palm Ave
- 412 Lotus Ct
- 412 Phlox Ct
- 246 E Fern Ave Unit 109
- 643 Cypress Cir
- 135 E Cypress Ave
- 254 E Fern Ave Unit 212
- 1089 Ardmore Cir
- 645 Cajon St
- 525 La Verne St Unit 14
- 434 Sonora Cir
- 0 W Palm Ave Unit IV25244005
- 506 Lytle St
- 423 Sonora Cir
- 261 E Crescent Ave
- 416 Sonora Cir
- 1032 Ardmore Cir
- 421 La Verne St
- 1049 Evergreen Ct
- 509 S 4th St
- 636 Orchard Dr
- 632 Orchard Dr
- 643 E Palm Ave
- 641 E Palm Ave
- 645 E Palm Ave
- 647 E Palm Ave
- 630 Orchard Dr
- 639 E Palm Ave
- 638 Orchard Dr
- 649 E Palm Ave
- 626 Orchard Dr
- 624 Orchard Dr
- 637 E Palm Ave
- 628 Orchard Dr
- 24774 E Redlands Blvd
- 622 Orchard Dr
- 633 E Palm Ave
- 629 E Palm Ave
- 631 E Palm Ave
- 627 E Palm Ave
Your Personal Tour Guide
Ask me questions while you tour the home.