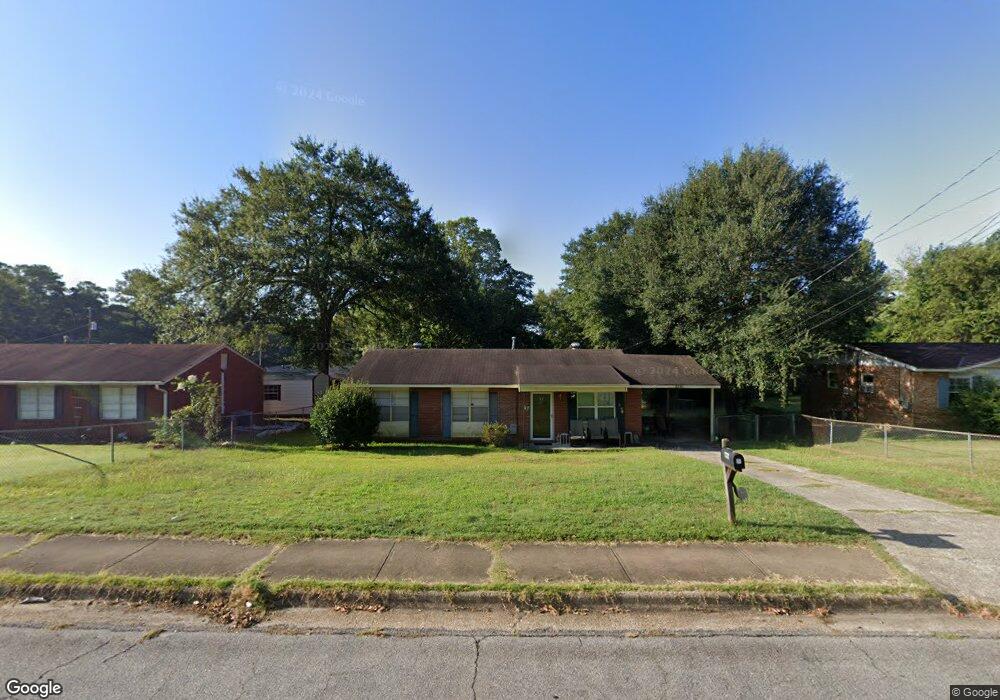
6346 Mill Branch Rd Columbus, GA 31907
Eastern Columbus NeighborhoodEstimated Value: $84,000 - $121,000
3
Beds
2
Baths
1,000
Sq Ft
$110/Sq Ft
Est. Value
About This Home
This home is located at 6346 Mill Branch Rd, Columbus, GA 31907 and is currently estimated at $110,251, approximately $110 per square foot. 6346 Mill Branch Rd is a home located in Muscogee County with nearby schools including Georgetown Elementary School, East Columbus Magnet Academy, and Kendrick High School.
Ownership History
Date
Name
Owned For
Owner Type
Purchase Details
Closed on
Dec 28, 2020
Sold by
Home Rental Properties Llc
Bought by
Wiggins Robert E
Current Estimated Value
Purchase Details
Closed on
Sep 8, 2015
Sold by
Jones Sandy
Bought by
Home Rental Properties Llc
Home Financials for this Owner
Home Financials are based on the most recent Mortgage that was taken out on this home.
Original Mortgage
$25,000
Interest Rate
3.97%
Mortgage Type
New Conventional
Purchase Details
Closed on
Jun 13, 2014
Sold by
Sec Of Housing & U
Bought by
Jones Sandy
Home Financials for this Owner
Home Financials are based on the most recent Mortgage that was taken out on this home.
Original Mortgage
$22,828
Interest Rate
4.23%
Mortgage Type
New Conventional
Purchase Details
Closed on
Sep 3, 2013
Sold by
Dlj Mtg Capital Inc
Bought by
Sec Of Housing & Urban
Create a Home Valuation Report for This Property
The Home Valuation Report is an in-depth analysis detailing your home's value as well as a comparison with similar homes in the area
Home Values in the Area
Average Home Value in this Area
Purchase History
| Date | Buyer | Sale Price | Title Company |
|---|---|---|---|
| Wiggins Robert E | -- | None Listed On Document | |
| Home Rental Properties Llc | $25,000 | -- | |
| Jones Sandy | $23,000 | -- | |
| Sec Of Housing & Urban | $80,216 | -- | |
| Dlj Mtg Capital Inc | $80,216 | -- |
Source: Public Records
Mortgage History
| Date | Status | Borrower | Loan Amount |
|---|---|---|---|
| Previous Owner | Home Rental Properties Llc | $25,000 | |
| Previous Owner | Jones Sandy | $22,828 |
Source: Public Records
Tax History Compared to Growth
Tax History
| Year | Tax Paid | Tax Assessment Tax Assessment Total Assessment is a certain percentage of the fair market value that is determined by local assessors to be the total taxable value of land and additions on the property. | Land | Improvement |
|---|---|---|---|---|
| 2025 | $1,195 | $30,536 | $5,724 | $24,812 |
| 2024 | $1,016 | $30,536 | $5,724 | $24,812 |
| 2023 | $1,203 | $30,536 | $5,724 | $24,812 |
| 2022 | $873 | $21,376 | $5,724 | $15,652 |
| 2021 | $768 | $18,808 | $5,724 | $13,084 |
| 2020 | $640 | $15,680 | $4,704 | $10,976 |
| 2019 | $642 | $15,680 | $4,704 | $10,976 |
| 2018 | $642 | $15,680 | $4,704 | $10,976 |
| 2017 | $681 | $15,680 | $4,704 | $10,976 |
| 2016 | $380 | $9,200 | $2,499 | $6,701 |
| 2015 | $380 | $9,200 | $2,499 | $6,701 |
| 2014 | $1,078 | $30,667 | $2,499 | $28,168 |
| 2013 | -- | $30,667 | $2,499 | $28,168 |
Source: Public Records
Map
Nearby Homes
- 1607 Mazor Dr
- 1322 Melford Dr
- 6213 Fitzgerald Dr
- 1826 Woodhollow Dr
- 1925 Woodhollow Dr
- 6620 Cove Cir
- 1754 Mazor Dr
- 6188 Valencia Dr
- 6047 Capri Cir
- 6119 Mill Branch Rd
- 6032 Cordova Rd
- 6061 Luna Dr
- 6033 Luna Dr
- 1068 Valencia Dr
- 1252 School House Dr
- 5834 Blueridge Dr
- 6223 Georgetown Dr
- 6916 Bradshaw Dr
- 1111 Richland Dr
- 5500 Amber Dr
- 6340 Mill Branch Rd
- 6352 Mill Branch Rd
- 1543 Mazor Dr
- 3 Newick Ct
- 6334 Mill Branch Rd
- 4 Newick Ct
- 1537 Mazor Dr
- 6351 Mill Branch Rd
- 6343 Mill Branch Rd
- 1548 Mazor Dr
- 2 Newick Ct
- 1531 Mazor Dr
- 1554 Mazor Dr
- 5 Newick Ct
- 6331 Mill Branch Rd
- 1542 Mazor Dr
- 1600 Mazor Dr
- 1525 Mazor Dr
- 1536 Mazor Dr
- 1606 Mazor Dr