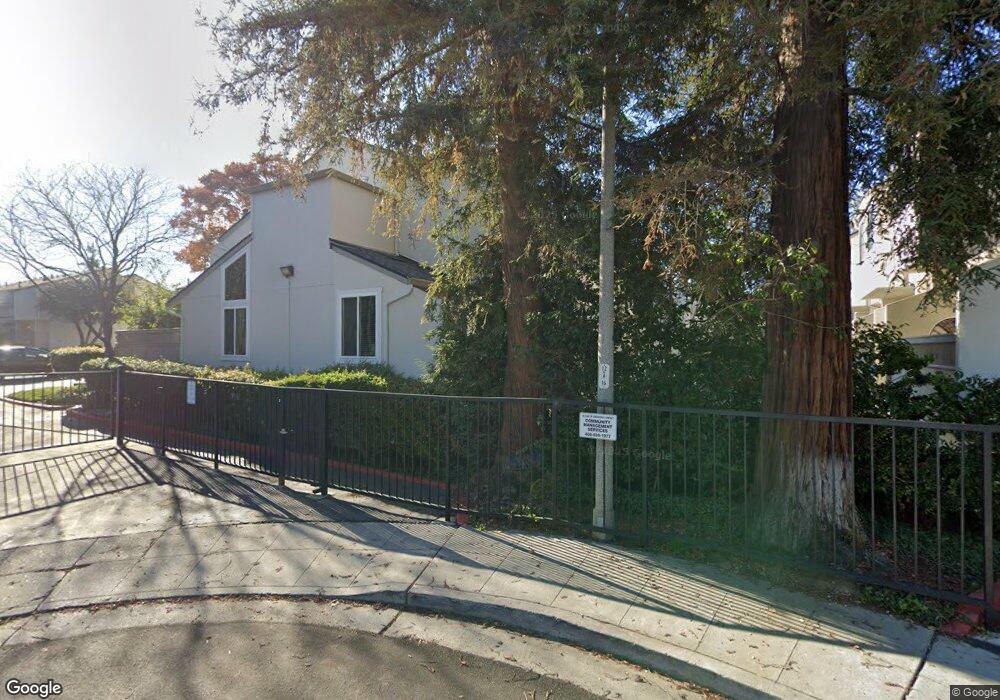
635 E Garland Terrace Unit 73 Sunnyvale, CA 94086
Ponderosa Park NeighborhoodEstimated Value: $1,093,000 - $1,142,000
3
Beds
3
Baths
1,368
Sq Ft
$815/Sq Ft
Est. Value
About This Home
This home is located at 635 E Garland Terrace Unit 73, Sunnyvale, CA 94086 and is currently estimated at $1,115,597, approximately $815 per square foot. 635 E Garland Terrace Unit 73 is a home located in Santa Clara County with nearby schools including Ellis Elementary School, Sunnyvale Middle School, and Fremont High School.
Ownership History
Date
Name
Owned For
Owner Type
Purchase Details
Closed on
Apr 7, 2004
Sold by
Pesic Ivan
Bought by
Pesic Ivan and Pesic Katherine
Current Estimated Value
Home Financials for this Owner
Home Financials are based on the most recent Mortgage that was taken out on this home.
Original Mortgage
$302,200
Interest Rate
5.57%
Mortgage Type
New Conventional
Purchase Details
Closed on
Mar 25, 2004
Sold by
Pesic Katherine
Bought by
Pesic Ivan
Home Financials for this Owner
Home Financials are based on the most recent Mortgage that was taken out on this home.
Original Mortgage
$302,200
Interest Rate
5.57%
Mortgage Type
New Conventional
Purchase Details
Closed on
Mar 14, 2000
Sold by
Ee Call Limited Partnership 10/15/93
Bought by
Pesic Ivan and Pesic Katherine
Purchase Details
Closed on
Oct 29, 1993
Sold by
Pesic Ivan M and Ngai Pesic Katherine
Bought by
Ee Call Limited Partnership
Create a Home Valuation Report for This Property
The Home Valuation Report is an in-depth analysis detailing your home's value as well as a comparison with similar homes in the area
Home Values in the Area
Average Home Value in this Area
Purchase History
| Date | Buyer | Sale Price | Title Company |
|---|---|---|---|
| Pesic Ivan | -- | Commonwealth Land Title | |
| Pesic Ivan | -- | Commonwealth Land Title | |
| Pesic Ivan | -- | Alliance Title Company | |
| Ee Call Limited Partnership | -- | -- |
Source: Public Records
Mortgage History
| Date | Status | Borrower | Loan Amount |
|---|---|---|---|
| Previous Owner | Pesic Ivan | $302,200 |
Source: Public Records
Tax History Compared to Growth
Tax History
| Year | Tax Paid | Tax Assessment Tax Assessment Total Assessment is a certain percentage of the fair market value that is determined by local assessors to be the total taxable value of land and additions on the property. | Land | Improvement |
|---|---|---|---|---|
| 2025 | $3,962 | $331,406 | $161,451 | $169,955 |
| 2024 | $3,962 | $324,909 | $158,286 | $166,623 |
| 2023 | $3,917 | $318,539 | $155,183 | $163,356 |
| 2022 | $3,850 | $312,294 | $152,141 | $160,153 |
| 2021 | $3,812 | $306,171 | $149,158 | $157,013 |
| 2020 | $3,765 | $303,033 | $147,629 | $155,404 |
| 2019 | $3,685 | $297,092 | $144,735 | $152,357 |
| 2018 | $3,614 | $291,268 | $141,898 | $149,370 |
| 2017 | $3,570 | $285,558 | $139,116 | $146,442 |
| 2016 | $3,420 | $279,960 | $136,389 | $143,571 |
| 2015 | $3,440 | $275,756 | $134,341 | $141,415 |
| 2014 | $3,375 | $270,355 | $131,710 | $138,645 |
Source: Public Records
Map
Nearby Homes
- 750 Calla Dr
- 545 E Olive Ave
- 863 Laburnum Dr
- 255 Honeylocust Terrace
- 733 E Evelyn Ave
- 146 Incense Terrace
- 495 Lincoln Ave
- 107 Lemmon Terrace
- 959 Reed Ave
- 836 Mist Flower Terrace Unit 2
- 421 E Washington Ave
- 389 E Washington Ave
- 224 Carroll St Unit 4
- 248 Red Oak Dr E Unit A
- 220 Red Oak Dr W Unit B
- 474 Sequoia Dr
- 134 Carroll St Unit 201
- 1229 Picasso Dr
- 999 W Evelyn Terrace Unit 54
- 541 Holthouse Terrace
- 639 E Garland Terrace Unit 72
- 631 E Garland Terrace
- 634 W Garland Terrace
- 643 E Garland Terrace
- 622 N Garland Terrace Unit 83
- 618 N Garland Terrace
- 626 N Garland Terrace Unit 84
- 647 E Garland Terrace Unit 97
- 632 W Garland Terrace
- 651 E Garland Terrace
- 630 W Garland Terrace Unit 77
- 614 N Garland Terrace
- 636 W Garland Terrace
- 621 Grand Fir Ave Unit 3
- 621 Grand Fir Ave
- 610 N Garland Terrace
- 628 W Garland Terrace
- 638 W Garland Terrace
- 640 W Garland Terrace
- 606 N Garland Terrace Unit 79