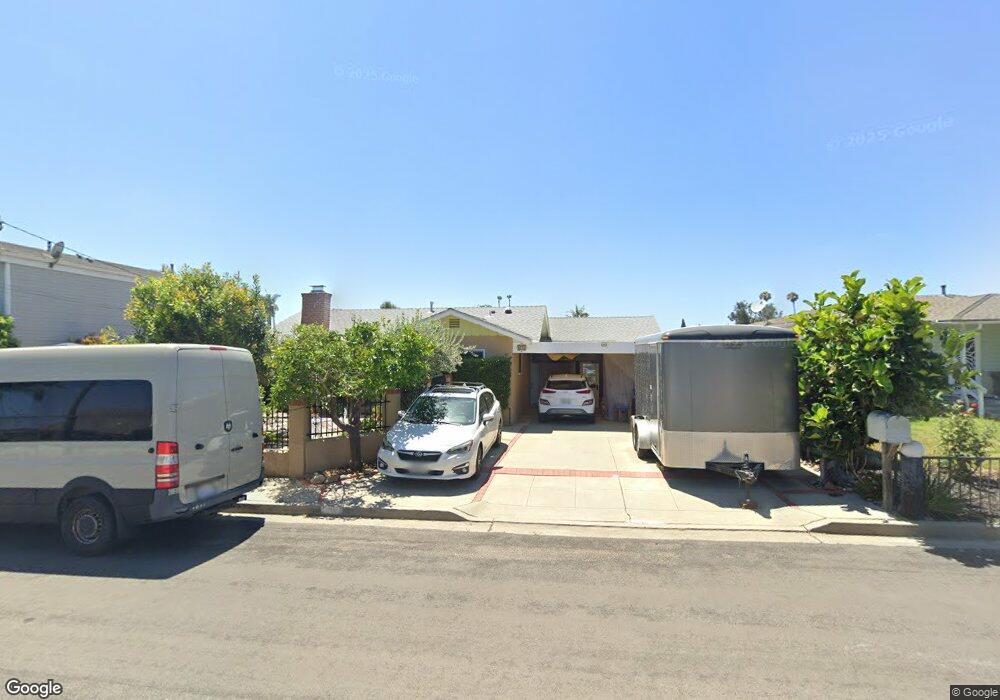
635 Rockledge St Oceanside, CA 92054
Downtown Oceanside NeighborhoodEstimated Value: $1,067,004 - $1,674,000
3
Beds
2
Baths
1,592
Sq Ft
$878/Sq Ft
Est. Value
About This Home
This home is located at 635 Rockledge St, Oceanside, CA 92054 and is currently estimated at $1,397,751, approximately $877 per square foot. 635 Rockledge St is a home located in San Diego County with nearby schools including Laurel Elementary School, Lincoln Middle School, and Oceanside High School.
Ownership History
Date
Name
Owned For
Owner Type
Purchase Details
Closed on
Oct 24, 2007
Sold by
Jorgensen Cheryl Annette and Jones Cheryl Annette
Bought by
Jones Jeffrey E
Current Estimated Value
Purchase Details
Closed on
Mar 31, 1994
Sold by
Jones Cheryl Annette
Bought by
Jones Jeffrey E
Home Financials for this Owner
Home Financials are based on the most recent Mortgage that was taken out on this home.
Original Mortgage
$105,000
Interest Rate
7.38%
Purchase Details
Closed on
Jul 27, 1987
Create a Home Valuation Report for This Property
The Home Valuation Report is an in-depth analysis detailing your home's value as well as a comparison with similar homes in the area
Home Values in the Area
Average Home Value in this Area
Purchase History
| Date | Buyer | Sale Price | Title Company |
|---|---|---|---|
| Jones Jeffrey E | -- | None Available | |
| Jones Jeffrey E | -- | Union Land Title Company | |
| -- | $106,300 | -- |
Source: Public Records
Mortgage History
| Date | Status | Borrower | Loan Amount |
|---|---|---|---|
| Previous Owner | Jones Jeffrey E | $105,000 |
Source: Public Records
Tax History
| Year | Tax Paid | Tax Assessment Tax Assessment Total Assessment is a certain percentage of the fair market value that is determined by local assessors to be the total taxable value of land and additions on the property. | Land | Improvement |
|---|---|---|---|---|
| 2025 | $2,238 | $206,609 | $76,544 | $130,065 |
| 2024 | $2,238 | $202,559 | $75,044 | $127,515 |
| 2023 | $2,167 | $198,588 | $73,573 | $125,015 |
| 2022 | $2,133 | $194,695 | $72,131 | $122,564 |
| 2021 | $2,140 | $190,878 | $70,717 | $120,161 |
| 2020 | $2,074 | $188,921 | $69,992 | $118,929 |
| 2019 | $2,013 | $185,218 | $68,620 | $116,598 |
| 2018 | $1,990 | $181,587 | $67,275 | $114,312 |
| 2017 | $70 | $178,027 | $65,956 | $112,071 |
| 2016 | $1,887 | $174,537 | $64,663 | $109,874 |
| 2015 | $1,832 | $171,916 | $63,692 | $108,224 |
| 2014 | $1,762 | $168,550 | $62,445 | $106,105 |
Source: Public Records
Map
Nearby Homes
- 1120 Sea Glass Way
- 1121 Makena Way
- 1635 E Minnesota Ave Unit 1,3
- 909 Leonard Ave
- 509 Rockledge St
- 911 Minnesota Ave
- 503 505 N Nevada St
- 722 &718 N Freeman St
- 520 Grant St
- 122 Beechwood Ln
- 35 Parkwood Ln
- 525 S Freeman St
- 1009 S Coast Hwy
- 324 S Nevada St
- 301 S Horne St
- 907 S Tremont St
- 522 S Cleveland St Unit 7
- 912 S Tremont St
- 465 S Cleveland St Unit 103
- 514 S Myers St
- 637 Rockledge St
- 627 Rockledge St
- 625 Rockledge St
- 636 Rockledge St
- 630 Rockledge St
- 1506 Wisconsin Ave
- 619 Rockledge St
- 644 Rockledge St
- 620 Brooks St
- 620 Rockledge St
- 1177 Leonard Ave
- 615 Rockledge St
- 1187 Leonard Ave
- 911 Vine St
- 913 Vine St
- 633 Brooks St
- 637 Brooks St
- 915 Vine St
- 614 Brooks St
- 616 Rockledge St
Your Personal Tour Guide
Ask me questions while you tour the home.