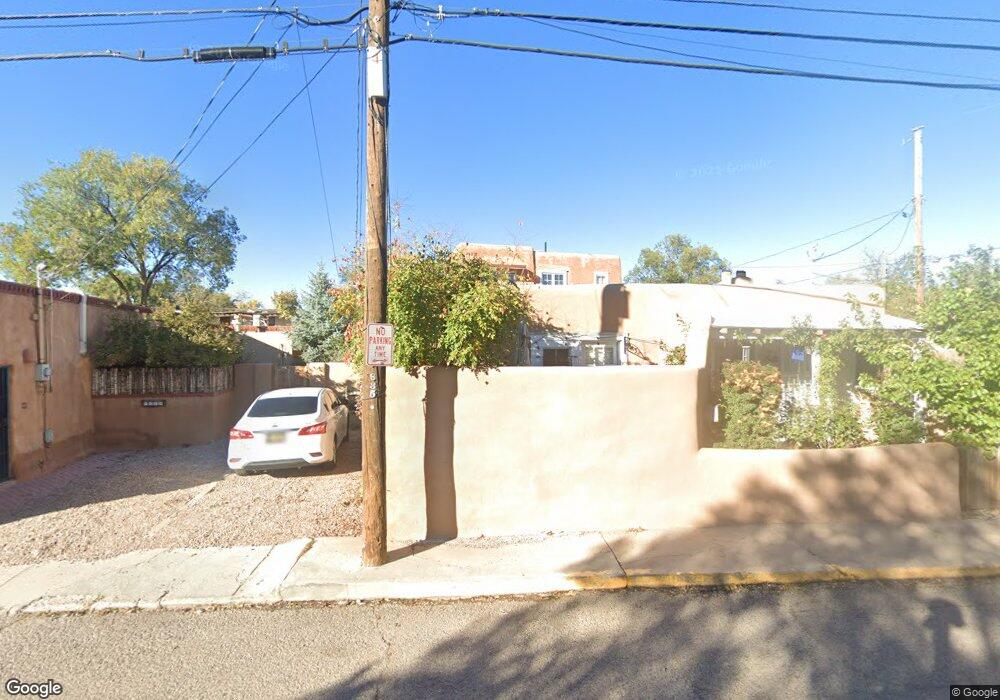
635 W San Francisco St Unit A & B Santa Fe, NM 87501
West Guadalupe Historic NeighborhoodEstimated Value: $602,000 - $1,355,000
3
Beds
3
Baths
692
Sq Ft
$1,186/Sq Ft
Est. Value
About This Home
This home is located at 635 W San Francisco St Unit A & B, Santa Fe, NM 87501 and is currently estimated at $821,003, approximately $1,186 per square foot. 635 W San Francisco St Unit A & B is a home located in Santa Fe County with nearby schools including Carlos Gilbert Elementary School, Santa Fe High School, and New Mexico School for the Arts.
Ownership History
Date
Name
Owned For
Owner Type
Purchase Details
Closed on
Mar 11, 2019
Sold by
Miller Lois L and Huang Richard A
Bought by
Birch Beryl Bender
Current Estimated Value
Home Financials for this Owner
Home Financials are based on the most recent Mortgage that was taken out on this home.
Original Mortgage
$264,000
Outstanding Balance
$232,101
Interest Rate
4.4%
Mortgage Type
New Conventional
Estimated Equity
$588,902
Purchase Details
Closed on
Nov 30, 2001
Sold by
Schwartz George R
Bought by
Conlee Christopher L and Conlee Sandra K
Home Financials for this Owner
Home Financials are based on the most recent Mortgage that was taken out on this home.
Original Mortgage
$174,800
Interest Rate
6.59%
Create a Home Valuation Report for This Property
The Home Valuation Report is an in-depth analysis detailing your home's value as well as a comparison with similar homes in the area
Home Values in the Area
Average Home Value in this Area
Purchase History
| Date | Buyer | Sale Price | Title Company |
|---|---|---|---|
| Birch Beryl Bender | -- | Prima Title Llc | |
| Conlee Christopher L | -- | Southwestern Title & Escrow |
Source: Public Records
Mortgage History
| Date | Status | Borrower | Loan Amount |
|---|---|---|---|
| Open | Birch Beryl Bender | $264,000 | |
| Previous Owner | Conlee Christopher L | $174,800 |
Source: Public Records
Tax History Compared to Growth
Tax History
| Year | Tax Paid | Tax Assessment Tax Assessment Total Assessment is a certain percentage of the fair market value that is determined by local assessors to be the total taxable value of land and additions on the property. | Land | Improvement |
|---|---|---|---|---|
| 2024 | $4,340 | $569,482 | $205,000 | $364,482 |
| 2023 | $3,438 | $437,982 | $175,048 | $262,934 |
| 2022 | $3,362 | $425,226 | $169,950 | $255,276 |
| 2021 | $3,310 | $137,614 | $54,999 | $82,615 |
| 2020 | $3,278 | $136,396 | $54,999 | $81,397 |
| 2019 | $2,784 | $114,095 | $58,333 | $55,762 |
| 2018 | $2,723 | $110,772 | $58,333 | $52,439 |
| 2017 | $2,655 | $107,546 | $58,333 | $49,213 |
| 2016 | $2,503 | $104,413 | $58,333 | $46,080 |
| 2015 | $2,445 | $101,372 | $58,333 | $43,039 |
| 2014 | $2,299 | $98,322 | $58,275 | $40,047 |
Source: Public Records
Map
Nearby Homes
- 654 B W San Francisco St
- 604 W Alameda St
- 669 W San Francisco St
- 534 1/2 W Alameda St
- 637 Alto St Unit C
- 640 Alto St
- 126 Duran St
- 132 1/2 Duran St Unit C
- 127 Duran St Unit A
- 615 Don Felix St
- 231 Closson St Unit 3
- 215 Alto Ln Unit D
- 246 Maynard St
- 232 Irvine St Unit 2
- 218 de Fouri St
- 509 & 511 Agua Fria St
- 839 1/2 Alto St
- 109 Romero St
- 604 Griffin St
- 304 Alegre St
- 635 W San Francisco St
- 635 W San Francisco St Unit A
- 635 W San Francisco St Unit B
- 635 W San Francisco Units A&b Combined Unit s A&B
- 635 W San Francisco #B Unit B
- 631 W San Francisco St Unit A
- 637 W San Francisco St
- 102 Jimenez St
- 104 Jimenez St
- 104 Jimenez St Unit C
- 104 Jimenez St Unit B
- 632 W San Francisco St
- 632 W San Francisco St
- 644 W San Francisco St
- 637 1/2 W San Francisco St
- 637 1/2 W San Francisco St
- 637 1/2 W San Francisco St
- 637 1/2 W San Francisco St
- 106 Jimenez St
- 646 W San Francisco St