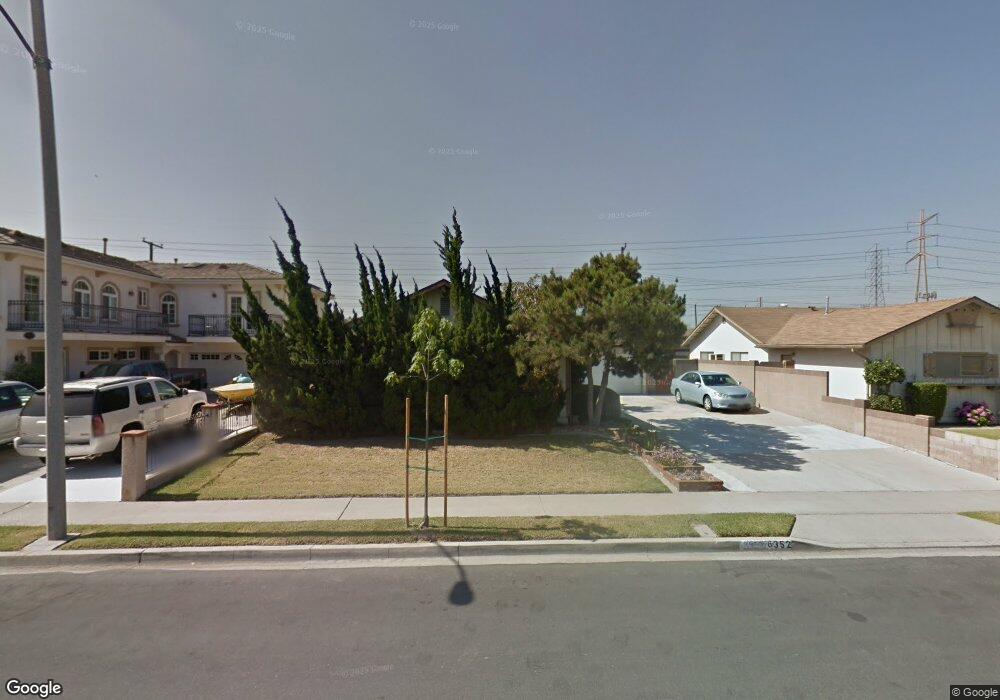
6352 Mcclellan Way Buena Park, CA 90620
Estimated Value: $888,825 - $959,000
4
Beds
2
Baths
1,497
Sq Ft
$621/Sq Ft
Est. Value
About This Home
This home is located at 6352 Mcclellan Way, Buena Park, CA 90620 and is currently estimated at $929,706, approximately $621 per square foot. 6352 Mcclellan Way is a home located in Orange County with nearby schools including Raymond Temple Elementary School, Walker Junior High School, and John F. Kennedy High School.
Ownership History
Date
Name
Owned For
Owner Type
Purchase Details
Closed on
Aug 27, 2022
Sold by
Yen Katie L
Bought by
Katie L Yen Trust and Yen
Current Estimated Value
Purchase Details
Closed on
Jul 30, 2020
Sold by
Yen Katie L and Chen Cindy Yen
Bought by
Yen Katie L and Chen Cindy Yen
Home Financials for this Owner
Home Financials are based on the most recent Mortgage that was taken out on this home.
Original Mortgage
$200,000
Interest Rate
3.1%
Mortgage Type
New Conventional
Purchase Details
Closed on
May 21, 1997
Sold by
Yen Katie L
Bought by
Yen Katie L and Yen Cindy Lu Hsin
Purchase Details
Closed on
Mar 12, 1997
Sold by
Hsin Yen Cindy Lu and Hsin Katie L
Bought by
Yen Katie L
Home Financials for this Owner
Home Financials are based on the most recent Mortgage that was taken out on this home.
Original Mortgage
$101,000
Interest Rate
7.74%
Create a Home Valuation Report for This Property
The Home Valuation Report is an in-depth analysis detailing your home's value as well as a comparison with similar homes in the area
Home Values in the Area
Average Home Value in this Area
Purchase History
| Date | Buyer | Sale Price | Title Company |
|---|---|---|---|
| Katie L Yen Trust | -- | None Listed On Document | |
| Yen Katie L | -- | Wfg National Title Company | |
| Yen Katie L | -- | -- | |
| Yen Katie L | -- | Continental Lawyers Title Co |
Source: Public Records
Mortgage History
| Date | Status | Borrower | Loan Amount |
|---|---|---|---|
| Previous Owner | Yen Katie L | $200,000 | |
| Previous Owner | Yen Katie L | $101,000 |
Source: Public Records
Tax History
| Year | Tax Paid | Tax Assessment Tax Assessment Total Assessment is a certain percentage of the fair market value that is determined by local assessors to be the total taxable value of land and additions on the property. | Land | Improvement |
|---|---|---|---|---|
| 2025 | $3,407 | $285,008 | $197,791 | $87,217 |
| 2024 | $3,407 | $279,420 | $193,913 | $85,507 |
| 2023 | $3,320 | $273,942 | $190,111 | $83,831 |
| 2022 | $3,275 | $268,571 | $186,383 | $82,188 |
| 2021 | $3,227 | $263,305 | $182,728 | $80,577 |
| 2020 | $3,207 | $260,606 | $180,855 | $79,751 |
| 2019 | $3,129 | $255,497 | $177,309 | $78,188 |
| 2018 | $3,073 | $250,488 | $173,833 | $76,655 |
| 2017 | $2,977 | $245,577 | $170,425 | $75,152 |
| 2016 | $2,921 | $240,762 | $167,083 | $73,679 |
| 2015 | $2,887 | $237,146 | $164,573 | $72,573 |
| 2014 | $2,745 | $232,501 | $161,349 | $71,152 |
Source: Public Records
Map
Nearby Homes
- 7641 Lee Dr
- 7571 San Rafael Dr
- 7800 La Corona Way
- 7425 Bradley Dr
- 7961 La Corona Way
- 8142 San Mateo Cir
- 5836 Trinidad Way
- 6871 Shoshonee Way
- 5826 Bolivia Dr
- 5842 Crestview Cir
- 5865 Brazil Dr
- 7531 Knott Ave
- 6996 Naomi Ave
- 6849 Whitman Dr
- 6861 Frost Cir
- 8291 San Helice Cir
- 5562 Thelma Ave
- 6430 Crescent Ave
- 5568 Ozawa Cir
- 7142 Orangethorpe Ave
- 6364 Mcclellan Way
- 6340 Mcclellan Way
- 6351 Sherman Way
- 6363 Sherman Way
- 6339 Sherman Way
- 6376 Mcclellan Way
- 6328 Mcclellan Way
- 6351 Mcclellan Way
- 6375 Sherman Way
- 6327 Sherman Way
- 6339 Mcclellan Way
- 6363 Mcclellan Way
- 6388 Mcclellan Way
- 6316 Mcclellan Way
- 6327 Mcclellan Way
- 6375 Mcclellan Way
- 6387 Sherman Way
- 6315 Sherman Way
- 6315 Mcclellan Way
- 6387 Mcclellan Way
Your Personal Tour Guide
Ask me questions while you tour the home.