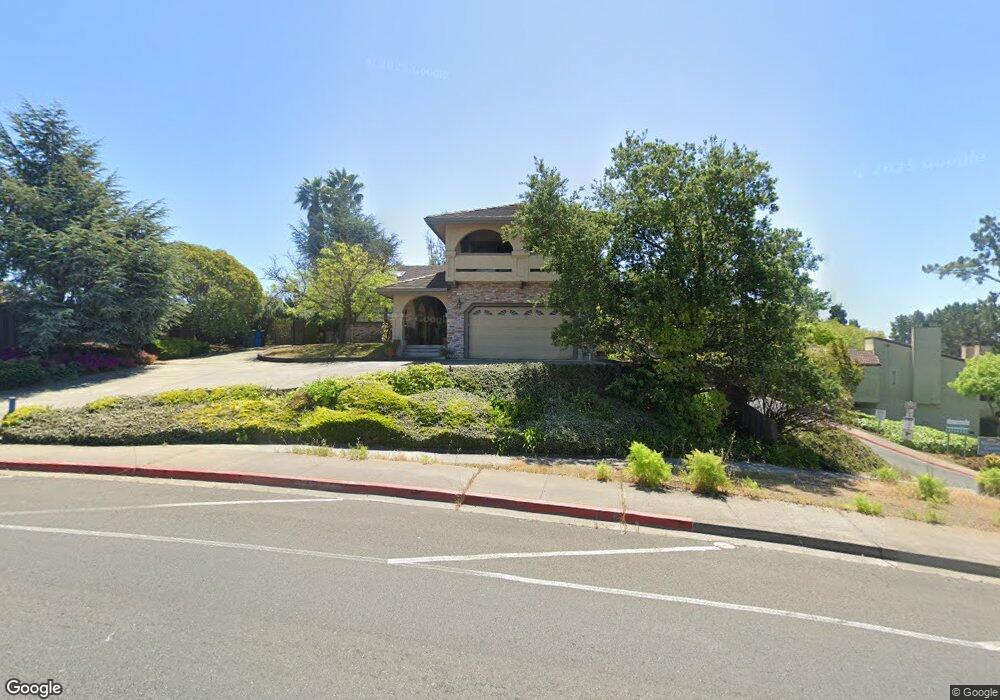
636 Admiral Callaghan Ln Vallejo, CA 94591
Sky View NeighborhoodEstimated Value: $655,000 - $798,000
4
Beds
3
Baths
2,640
Sq Ft
$270/Sq Ft
Est. Value
About This Home
This home is located at 636 Admiral Callaghan Ln, Vallejo, CA 94591 and is currently estimated at $712,970, approximately $270 per square foot. 636 Admiral Callaghan Ln is a home located in Solano County with nearby schools including Joseph H. Wardlaw Elementary School, Hogan Middle School, and Jesse M. Bethel High School.
Ownership History
Date
Name
Owned For
Owner Type
Purchase Details
Closed on
Aug 17, 2023
Sold by
Cohen-Bowman Nona M
Bought by
Nona M Cohen-Bowman Living Trust and Cohen-Bowman
Current Estimated Value
Purchase Details
Closed on
Oct 9, 2001
Sold by
Cohen Bowman Nona M
Bought by
Cohen Bowman Nona M
Home Financials for this Owner
Home Financials are based on the most recent Mortgage that was taken out on this home.
Original Mortgage
$325,000
Interest Rate
6.91%
Mortgage Type
Stand Alone First
Create a Home Valuation Report for This Property
The Home Valuation Report is an in-depth analysis detailing your home's value as well as a comparison with similar homes in the area
Home Values in the Area
Average Home Value in this Area
Purchase History
| Date | Buyer | Sale Price | Title Company |
|---|---|---|---|
| Nona M Cohen-Bowman Living Trust | -- | Fidelity National Title | |
| Cohen Bowman Nona M | -- | Fidelity National Title Co |
Source: Public Records
Mortgage History
| Date | Status | Borrower | Loan Amount |
|---|---|---|---|
| Previous Owner | Cohen Bowman Nona M | $325,000 |
Source: Public Records
Tax History Compared to Growth
Tax History
| Year | Tax Paid | Tax Assessment Tax Assessment Total Assessment is a certain percentage of the fair market value that is determined by local assessors to be the total taxable value of land and additions on the property. | Land | Improvement |
|---|---|---|---|---|
| 2025 | $7,937 | $618,940 | $106,101 | $512,839 |
| 2024 | $7,937 | $606,805 | $104,021 | $502,784 |
| 2023 | $7,550 | $594,908 | $101,982 | $492,926 |
| 2022 | $7,482 | $583,244 | $99,983 | $483,261 |
| 2021 | $7,306 | $571,809 | $98,023 | $473,786 |
| 2020 | $7,374 | $554,850 | $95,116 | $459,734 |
| 2019 | $7,198 | $543,971 | $93,251 | $450,720 |
| 2018 | $6,479 | $519,000 | $62,000 | $457,000 |
| 2017 | $6,134 | $501,000 | $65,000 | $436,000 |
| 2016 | $5,404 | $478,000 | $66,000 | $412,000 |
| 2015 | $5,391 | $476,000 | $71,000 | $405,000 |
| 2014 | $4,367 | $384,000 | $58,000 | $326,000 |
Source: Public Records
Map
Nearby Homes
- 300 Kathy Ellen Dr
- 608 Admiral Callaghan Ln
- 226 Kathy Ellen Dr
- 621 Admiral Callaghan Ln
- 160 Kathy Ellen Dr
- 1361 Mariposa St
- 602 Fleming Ave E
- 125 Combs Ln
- 100 Percheron Ct
- 249 Howard Ave
- 1201 Valle Vista Ave
- 121 Kim Ct
- 1588 Vervais Ave
- 400 Foothill Dr
- 172 Delgado Ct
- 108 San Gorgonio Ave
- 135 Bayview Ave
- 608 La Cadena St
- 1086 Calaveras Way
- 373 Clydesdale Dr
- 155 Pajaro Way
- 644 Admiral Callaghan Ln
- 316 Kathy Ellen Dr
- 314 Kathy Ellen Dr
- 149 Pajaro Way
- 300 Kathy Ellen Dr Unit Kathy Ellen
- 312 Kathy Ellen Dr
- 650 Admiral Callaghan Ln
- 148 Pajaro Way
- 100 Michele Ct
- 298 Kathy Ellen Dr
- 101 Michele Ct
- 310 Kathy Ellen Dr
- 296 Kathy Ellen Dr
- 123 Michele Ct
- 143 Pajaro Way
- 294 Kathy Ellen Dr
- 288 Kathy Ellen Dr
- 142 Pajaro Way
- 108 Michele Ct