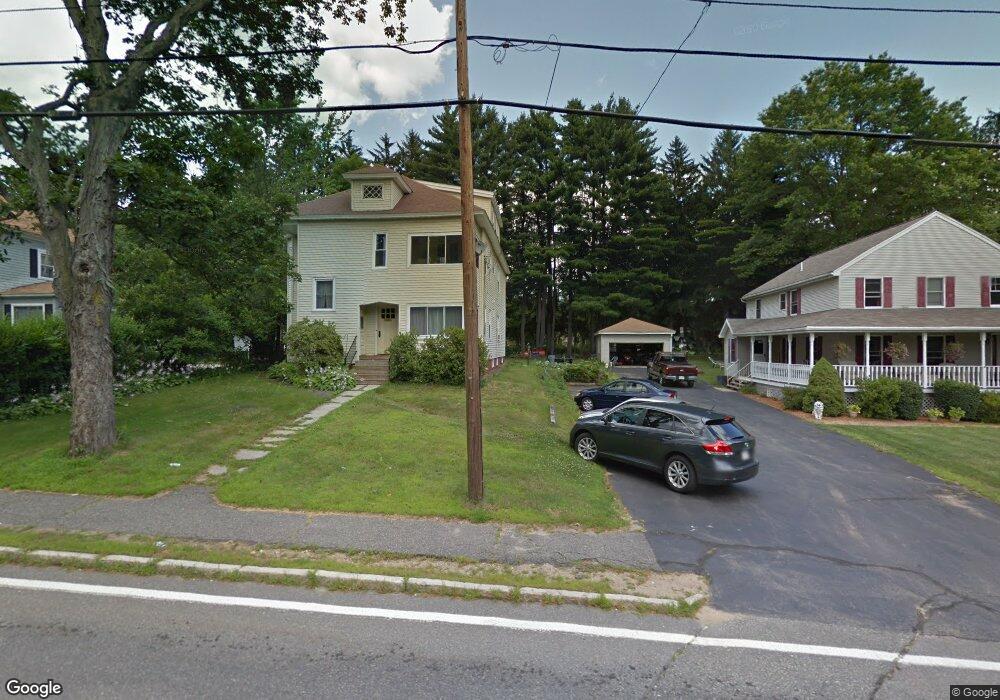
636 Grove St Worcester, MA 01605
Forest Grove NeighborhoodEstimated Value: $593,000 - $656,000
About This Home
Charming 2-Bedroom Rental Home in Worcester Welcome to 636 Grove Street, a delightful rental property offering comfort and convenience in a sought-after Worcester neighborhood. This spacious 2-bedroom, 1-bathroom home features 1,300 sq ft of living space, perfect for families or professionals looking for a peaceful and well-maintained residence.
Property Highlights:
Rent: $2,000 per month; First month, Last Month, and 1/2 Month due as Security Deposit at Move in
Size: 1,300 sq ft
Parking: Off-street parking available
Yard: Enjoy a large, private backyard ideal for outdoor activities and relaxation
Safety: Located in a safe, friendly neighborhood
Owner Notes: The owner resides next door, ensuring prompt attention to any needs or concerns
Included:
Water and Sewer
The Renter must pay for all other utilities.
Please Note and absolutely no exceptions:
- No pets allowed
- No smoking permitted on the premises inside or outside
- Must sign lease with Owner
This lovely home offers a blend of comfort and convenience, with easy access to local amenities and a welcoming community atmosphere. If you’re looking for a cozy and well-kept home in Worcester, this is the perfect choice!
For more details or to schedule a viewing, please contact us today. We look forward to welcoming you to your new home at 636 Grove Street!
Ownership History
Purchase Details
Home Financials for this Owner
Home Financials are based on the most recent Mortgage that was taken out on this home.Home Values in the Area
Average Home Value in this Area
Purchase History
| Date | Buyer | Sale Price | Title Company |
|---|---|---|---|
| Lyons Robert X | $127,650 | -- | |
| Lyons Robert X | $127,650 | -- |
Mortgage History
| Date | Status | Borrower | Loan Amount |
|---|---|---|---|
| Closed | Lyons Robert X | $125,400 | |
| Closed | Lyons Robert X | $125,000 | |
| Closed | Lyons Robert X | $126,376 |
Property History
| Date | Event | Price | List to Sale | Price per Sq Ft |
|---|---|---|---|---|
| 09/14/2024 09/14/24 | For Rent | $1,800 | -- | -- |
Tax History
| Year | Tax Paid | Tax Assessment Tax Assessment Total Assessment is a certain percentage of the fair market value that is determined by local assessors to be the total taxable value of land and additions on the property. | Land | Improvement |
|---|---|---|---|---|
| 2025 | $7,450 | $564,800 | $123,500 | $441,300 |
| 2024 | $7,098 | $516,200 | $123,500 | $392,700 |
| 2023 | $6,618 | $461,500 | $106,300 | $355,200 |
| 2022 | $6,092 | $400,500 | $85,100 | $315,400 |
| 2021 | $5,579 | $342,700 | $68,100 | $274,600 |
| 2020 | $13 | $308,100 | $67,900 | $240,200 |
| 2019 | $5,855 | $296,500 | $65,500 | $231,000 |
| 2018 | $5,234 | $276,800 | $65,500 | $211,300 |
| 2017 | $4,997 | $260,000 | $65,500 | $194,500 |
| 2016 | $5,043 | $244,700 | $53,500 | $191,200 |
| 2015 | $4,911 | $244,700 | $53,500 | $191,200 |
| 2014 | $4,781 | $244,700 | $53,500 | $191,200 |
Map
Ask me questions while you tour the home.