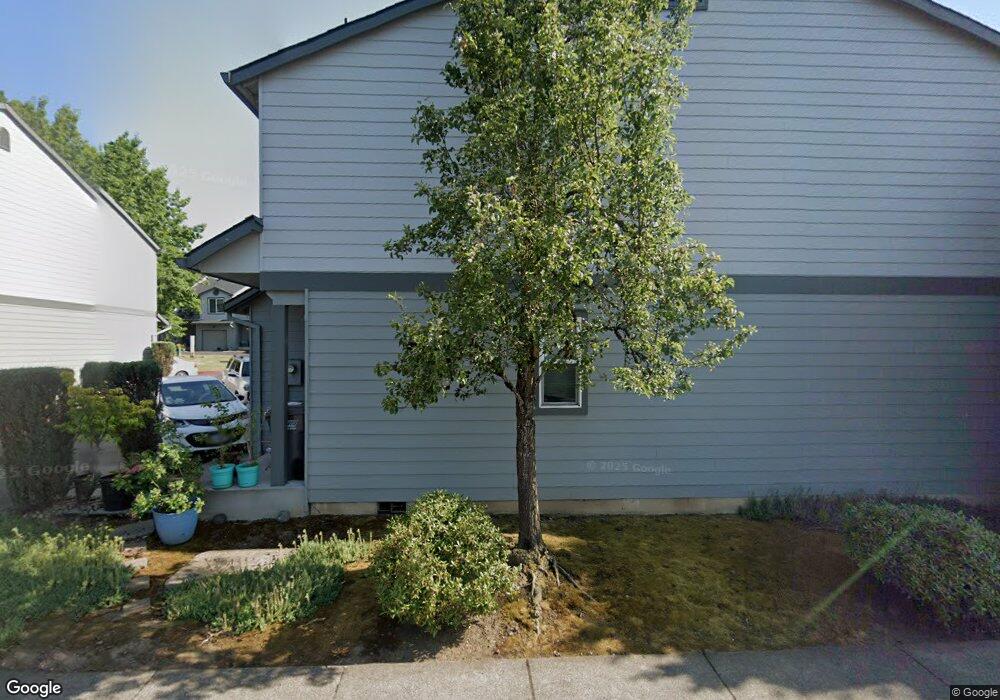
636 NE 9th St Gresham, OR 97030
Downtown Gresham NeighborhoodEstimated Value: $313,377 - $332,000
Studio
3
Baths
1,330
Sq Ft
$242/Sq Ft
Est. Value
About This Home
This home is located at 636 NE 9th St, Gresham, OR 97030 and is currently estimated at $321,344, approximately $241 per square foot. 636 NE 9th St is a home located in Multnomah County with nearby schools including Highland Elementary School, Clear Creek Middle School, and Gresham High School.
Ownership History
Date
Name
Owned For
Owner Type
Purchase Details
Closed on
Apr 9, 2004
Sold by
Landmark At Eighth Properties Llc
Bought by
Russell William D and Russell Joyce G
Current Estimated Value
Purchase Details
Closed on
Feb 1, 2001
Sold by
Peak Development Llc
Bought by
Rossman Ted
Home Financials for this Owner
Home Financials are based on the most recent Mortgage that was taken out on this home.
Original Mortgage
$125,600
Interest Rate
7.08%
Mortgage Type
Purchase Money Mortgage
Purchase Details
Closed on
Jan 30, 2001
Sold by
Lone Oak Construction Inc
Bought by
Peak Development Llc
Home Financials for this Owner
Home Financials are based on the most recent Mortgage that was taken out on this home.
Original Mortgage
$125,600
Interest Rate
7.08%
Mortgage Type
Purchase Money Mortgage
Create a Home Valuation Report for This Property
The Home Valuation Report is an in-depth analysis detailing your home's value as well as a comparison with similar homes in the area
Home Values in the Area
Average Home Value in this Area
Purchase History
| Date | Buyer | Sale Price | Title Company |
|---|---|---|---|
| Russell William D | $129,000 | Ticor Title Insurance Compan | |
| Landmark At Eighth Property Llc | -- | Ticor Title Insurance Compan | |
| Rossman Ted | $157,000 | Ticor Title | |
| Peak Development Llc | -- | Ticor Title |
Source: Public Records
Mortgage History
| Date | Status | Borrower | Loan Amount |
|---|---|---|---|
| Previous Owner | Rossman Ted | $125,600 |
Source: Public Records
Tax History
| Year | Tax Paid | Tax Assessment Tax Assessment Total Assessment is a certain percentage of the fair market value that is determined by local assessors to be the total taxable value of land and additions on the property. | Land | Improvement |
|---|---|---|---|---|
| 2025 | $2,639 | $129,700 | -- | -- |
| 2024 | $2,527 | $125,930 | -- | -- |
| 2023 | $2,302 | $122,270 | $0 | $0 |
| 2022 | $2,238 | $118,710 | $0 | $0 |
| 2021 | $2,181 | $115,260 | $0 | $0 |
| 2020 | $2,053 | $111,910 | $0 | $0 |
| 2019 | $2,061 | $108,660 | $0 | $0 |
| 2018 | $1,906 | $105,500 | $0 | $0 |
| 2017 | $1,829 | $102,430 | $0 | $0 |
| 2016 | $1,613 | $99,450 | $0 | $0 |
Source: Public Records
Map
Nearby Homes
- 660 NE 9th St
- 894 NE Linden Ave
- 491 NE Elliott Ave
- 210 NE 5th St
- 0 NE 6th St
- 234 NE Cleveland Ave
- 318 NE Roberts Ave Unit 308
- 318 NE Roberts Ave Unit 203
- 0 NE 5th St
- 824 NW Mignonette Ave
- 54 NW 13th St
- 1783 1791 NE Beech Place
- 349 NE 18th St
- 329 SE Linden Ct
- 1302 NE Hogan Dr
- 1308 NE Hogan Dr Unit 166
- 450 NE 22nd St
- 4740 SE 2nd St
- 4764 SE 2nd St
- 4667 SE 2nd St
Your Personal Tour Guide
Ask me questions while you tour the home.