636 Totman Ct Patterson, CA 95363
Estimated Value: $417,000 - $475,050
About This Home
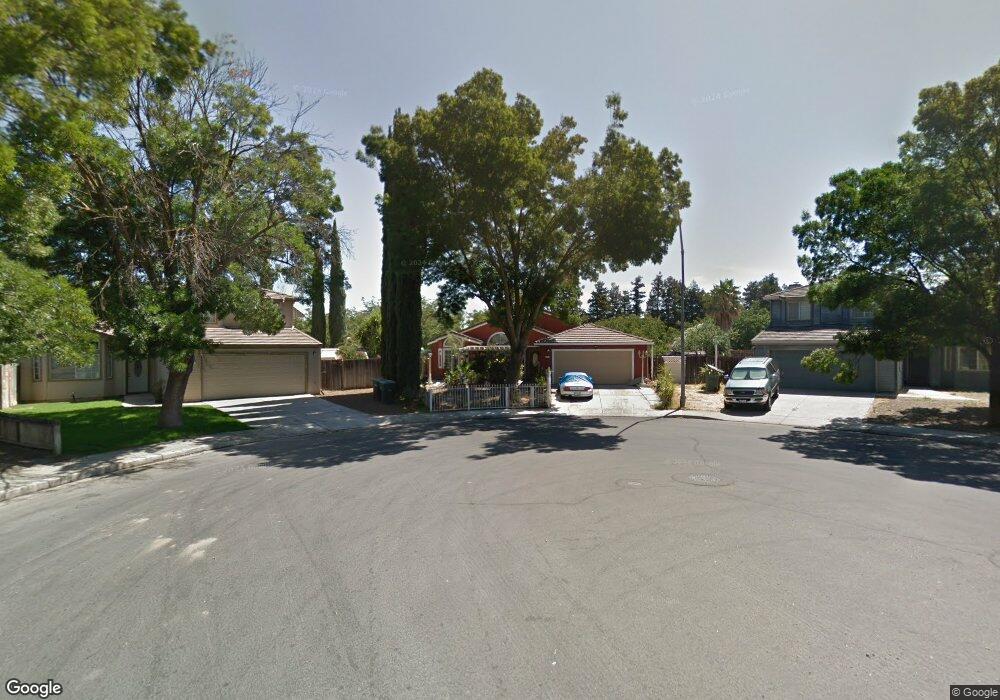
This home is located at 636 Totman Ct, Patterson, CA 95363 and is currently estimated at $446,263, approximately $324 per square foot. 636 Totman Ct is a home located in Stanislaus County with nearby schools including Walnut Grove Elementary School, Creekside Middle School, and Patterson High School.
Ownership History
We collect this data history from publicly available records. To have your information removed, we recommend requesting removal directly through your county’s website.
Purchase Details
Home Financials for this Owner
Home Financials are based on the most recent Mortgage that was taken out on this home.Purchase Details
Home Financials for this Owner
Home Financials are based on the most recent Mortgage that was taken out on this home.Purchase Details
Purchase Details
Home Financials for this Owner
Home Financials are based on the most recent Mortgage that was taken out on this home.Home Values in the Area
Average Home Value in this Area
Purchase History
We collect this data history from publicly available records. To have your information removed, we recommend requesting removal directly through your county’s website.
| Date | Buyer | Sale Price | Title Company |
|---|---|---|---|
| -- | Placer Title | ||
| -- | Chicago Title Co | ||
| -- | -- | ||
| -- | Stewart Title |
Mortgage History
We collect this data history from publicly available records. To have your information removed, we recommend requesting removal directly through your county’s website.
| Date | Status | Borrower | Loan Amount |
|---|---|---|---|
| Open | $73,000 | ||
| Previous Owner | $116,500 | ||
| Previous Owner | $107,900 |
Tax History
We collect this data history from publicly available records. To have your information removed, we recommend requesting removal directly through your county’s website.
| Year | Tax Paid | Tax Assessment Tax Assessment Total Assessment is a certain percentage of the fair market value that is determined by local assessors to be the total taxable value of land and additions on the property. | Land | Improvement |
|---|---|---|---|---|
| 2025 | $2,650 | $227,957 | $60,669 | $167,288 |
| 2024 | $2,641 | $223,488 | $59,480 | $164,008 |
| 2023 | $2,582 | $219,107 | $58,314 | $160,793 |
| 2022 | $2,437 | $214,812 | $57,171 | $157,641 |
| 2021 | $2,402 | $210,600 | $56,050 | $154,550 |
| 2020 | $2,403 | $208,442 | $55,476 | $152,966 |
| 2019 | $2,365 | $204,356 | $54,389 | $149,967 |
| 2018 | $2,253 | $200,350 | $53,323 | $147,027 |
| 2017 | $2,206 | $196,423 | $52,278 | $144,145 |
| 2016 | $2,147 | $192,572 | $51,253 | $141,319 |
| 2015 | $2,109 | $189,681 | $50,484 | $139,197 |
| 2014 | $1,707 | $153,000 | $25,000 | $128,000 |
Map
- 625 Periwinkle Dr
- 1430 Walnut Ave
- 526 Bedfordshire Dr
- 0 Locust Ave
- 608 Somerset Way
- 801 Chatham Ln
- 800 Chatham Ln
- 1248 E Las Palmas Ave
- 648 Cheshire Dr
- 809 Chatham Ln
- 16012 Sycamore Ave
- 817 Chatham Ln
- 816 Chatham Ln
- 817 Helmsley Ln
- 816 Helmsley Ln
- 821 Chatham Ln
- 820 Chatham Ln
- 821 Helmsley Ln
- 820 Helmsley Ln
- 829 Chatham Ln
- 631 Hillstock Ct
- 627 Hillstock Ct
- 635 Hillstock Ct
- 628 Totman Ct
- 632 Totman Ct
- 623 Hillstock Ct
- 624 Totman Ct
- 639 Hillstock Ct
- 628 Hillstock Ct
- 620 Totman Ct
- 624 Hillstock Ct
- 619 Hillstock Ct
- 636 Hillstock Ct
- 632 Hillstock Ct
- 620 Hillstock Ct
- 616 Totman Ct
- 616 Hillstock Ct
- 629 Totman Ct
- 625 Totman Ct
- 637 Totman Ct
Ask me questions while you tour the home.