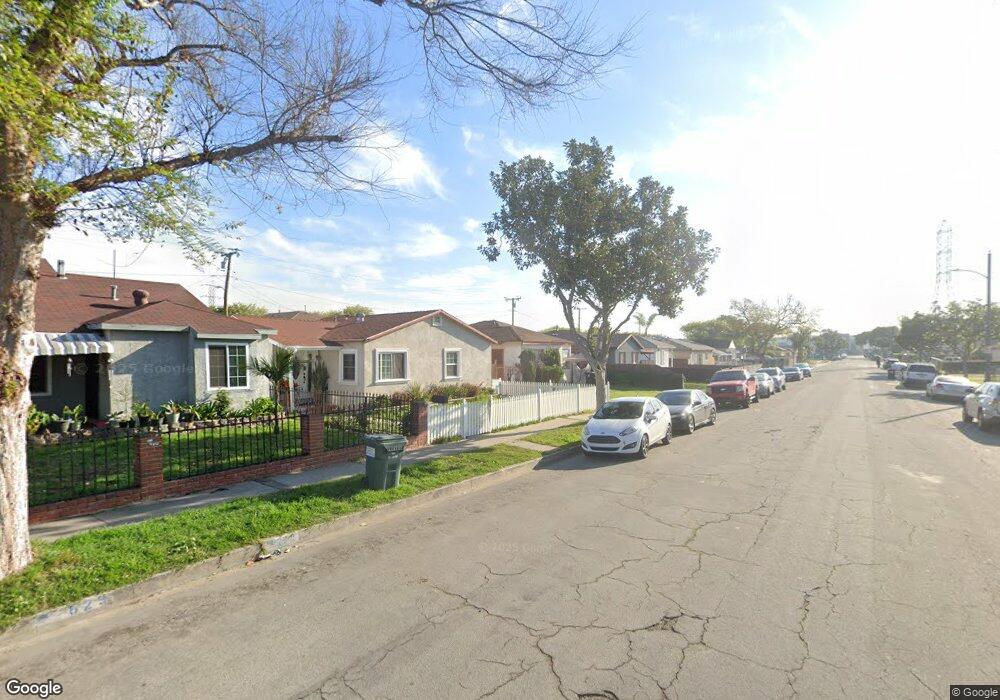
637 E 138th St Los Angeles, CA 90059
Estimated Value: $488,000 - $553,000
2
Beds
1
Bath
805
Sq Ft
$637/Sq Ft
Est. Value
About This Home
This home is located at 637 E 138th St, Los Angeles, CA 90059 and is currently estimated at $512,448, approximately $636 per square foot. 637 E 138th St is a home located in Los Angeles County with nearby schools including McKinley Elementary School, Enterprise Middle School, and Centennial High School.
Ownership History
Date
Name
Owned For
Owner Type
Purchase Details
Closed on
Jan 28, 1998
Sold by
Mccray Ronda P
Bought by
Mccray Donnell
Current Estimated Value
Home Financials for this Owner
Home Financials are based on the most recent Mortgage that was taken out on this home.
Original Mortgage
$4,250
Interest Rate
6.95%
Mortgage Type
Stand Alone Second
Purchase Details
Closed on
Apr 30, 1997
Sold by
Mccray Della
Bought by
Mccray Donnell
Home Financials for this Owner
Home Financials are based on the most recent Mortgage that was taken out on this home.
Original Mortgage
$68,000
Outstanding Balance
$11,367
Interest Rate
10.5%
Estimated Equity
$501,081
Purchase Details
Closed on
Nov 9, 1993
Sold by
Mccray Della
Bought by
Mccray Della
Home Financials for this Owner
Home Financials are based on the most recent Mortgage that was taken out on this home.
Original Mortgage
$38,000
Interest Rate
7.09%
Create a Home Valuation Report for This Property
The Home Valuation Report is an in-depth analysis detailing your home's value as well as a comparison with similar homes in the area
Home Values in the Area
Average Home Value in this Area
Purchase History
| Date | Buyer | Sale Price | Title Company |
|---|---|---|---|
| Mccray Donnell | -- | Southland Title Corporation | |
| Mccray Donnell | $85,000 | Southland Title Corporation | |
| Mccray Della | -- | Orange Coast Title |
Source: Public Records
Mortgage History
| Date | Status | Borrower | Loan Amount |
|---|---|---|---|
| Closed | Mccray Donnell | $4,250 | |
| Open | Mccray Donnell | $68,000 | |
| Closed | Mccray Della | $38,000 |
Source: Public Records
Tax History
| Year | Tax Paid | Tax Assessment Tax Assessment Total Assessment is a certain percentage of the fair market value that is determined by local assessors to be the total taxable value of land and additions on the property. | Land | Improvement |
|---|---|---|---|---|
| 2025 | $2,201 | $135,694 | $94,193 | $41,501 |
| 2024 | $2,201 | $133,035 | $92,347 | $40,688 |
| 2023 | $2,174 | $130,428 | $90,537 | $39,891 |
| 2022 | $2,047 | $127,871 | $88,762 | $39,109 |
| 2021 | $2,070 | $125,365 | $87,022 | $38,343 |
| 2019 | $2,015 | $121,648 | $84,442 | $37,206 |
| 2018 | $1,940 | $119,264 | $82,787 | $36,477 |
| 2016 | $1,838 | $114,634 | $79,573 | $35,061 |
| 2015 | $1,756 | $112,913 | $78,378 | $34,535 |
| 2014 | $1,733 | $110,702 | $76,843 | $33,859 |
Source: Public Records
Map
Nearby Homes
- 638 E 137th St
- 642 E 136th St
- 616 E 135th St
- 13426 Crocker St
- 13502 S San Pedro St
- 13719 S San Pedro St
- 13339 Crocker St
- 233 E 136th St
- 13113 Avalon Blvd
- 2015 N Belhaven Ave
- 403 E 131st St
- 14433 S Cahita Ave
- 825 Sweetbay Ln
- 1805 N Central Ave
- 2109 N Bahama Ave
- 13914 S Main St
- 2215 W 132nd St
- 1918 W Piru St
- 14609 S Cahita Ave
- 13107 Jarvis Ave
- 639 E 138th St
- 633 E 138th St
- 645 E 138th St Unit ADU
- 645 E 138th St
- 629 E 138th St
- 647 E 138th St
- 625 E 138th St
- 634 E 137th St
- 630 E 137th St
- 651 E 138th St
- 621 E 138th St
- 626 E 137th St
- 642 E 137th St
- 622 E 137th St
- 646 E 137th St
- 634 E 138th St
- 638 E 138th St
- 630 E 138th St
- 615 E 138th St
- 657 E 138th St
Your Personal Tour Guide
Ask me questions while you tour the home.