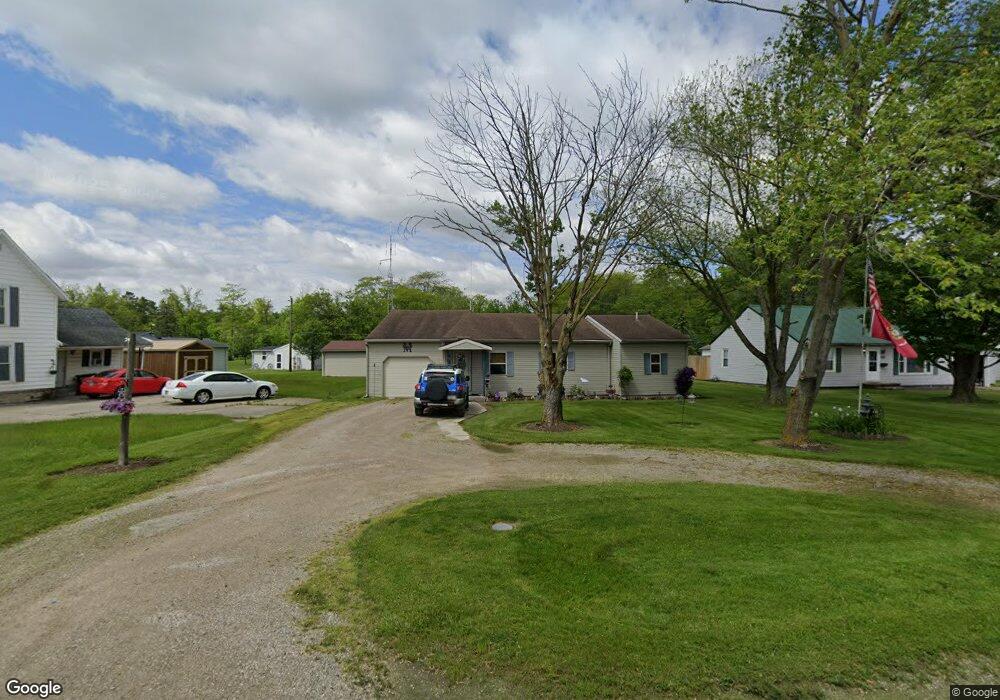
637 E Perry St Paulding, OH 45879
Estimated Value: $99,095 - $113,000
2
Beds
1
Bath
1,278
Sq Ft
$84/Sq Ft
Est. Value
About This Home
This home is located at 637 E Perry St, Paulding, OH 45879 and is currently estimated at $107,698, approximately $84 per square foot. 637 E Perry St is a home located in Paulding County with nearby schools including Paulding High School.
Ownership History
Date
Name
Owned For
Owner Type
Purchase Details
Closed on
Oct 15, 2009
Sold by
Sierer Stephen G and Sierer Sharon L
Bought by
Murray Charles Todd and Murray Elizabeth
Current Estimated Value
Home Financials for this Owner
Home Financials are based on the most recent Mortgage that was taken out on this home.
Original Mortgage
$22,000
Outstanding Balance
$14,123
Interest Rate
5.07%
Mortgage Type
Purchase Money Mortgage
Estimated Equity
$93,575
Purchase Details
Closed on
Oct 14, 2009
Sold by
Carlisle Kyle D
Bought by
Sierer Stephen G and Sierer Sharon L
Home Financials for this Owner
Home Financials are based on the most recent Mortgage that was taken out on this home.
Original Mortgage
$22,000
Outstanding Balance
$14,123
Interest Rate
5.07%
Mortgage Type
Purchase Money Mortgage
Estimated Equity
$93,575
Purchase Details
Closed on
Oct 25, 2005
Sold by
Sierer Stephen G and Sierer Sharon L
Bought by
Carlisle Kyle D
Home Financials for this Owner
Home Financials are based on the most recent Mortgage that was taken out on this home.
Original Mortgage
$29,500
Interest Rate
5.98%
Mortgage Type
Purchase Money Mortgage
Create a Home Valuation Report for This Property
The Home Valuation Report is an in-depth analysis detailing your home's value as well as a comparison with similar homes in the area
Home Values in the Area
Average Home Value in this Area
Purchase History
| Date | Buyer | Sale Price | Title Company |
|---|---|---|---|
| Murray Charles Todd | $22,000 | None Available | |
| Sierer Stephen G | -- | None Available | |
| Carlisle Kyle D | $30,000 | None Available |
Source: Public Records
Mortgage History
| Date | Status | Borrower | Loan Amount |
|---|---|---|---|
| Open | Murray Charles Todd | $22,000 | |
| Closed | Sierer Stephen G | $22,000 | |
| Previous Owner | Carlisle Kyle D | $29,500 |
Source: Public Records
Tax History
| Year | Tax Paid | Tax Assessment Tax Assessment Total Assessment is a certain percentage of the fair market value that is determined by local assessors to be the total taxable value of land and additions on the property. | Land | Improvement |
|---|---|---|---|---|
| 2025 | $1,330 | $30,700 | $8,470 | $22,230 |
| 2024 | $1,330 | $24,610 | $7,250 | $17,360 |
| 2023 | $1,182 | $24,610 | $7,250 | $17,360 |
| 2022 | $1,074 | $24,610 | $7,250 | $17,360 |
| 2021 | $1,008 | $20,580 | $7,210 | $13,370 |
| 2020 | $902 | $20,580 | $7,210 | $13,370 |
| 2019 | $909 | $19,950 | $7,210 | $12,740 |
| 2018 | $897 | $19,950 | $7,210 | $12,740 |
| 2017 | $898 | $19,950 | $7,210 | $12,740 |
| 2016 | $898 | $19,950 | $7,210 | $12,740 |
| 2015 | $747 | $16,870 | $7,140 | $9,730 |
| 2014 | $743 | $16,870 | $7,140 | $9,730 |
| 2013 | $804 | $16,870 | $7,140 | $9,730 |
Source: Public Records
Map
Nearby Homes
- 641 E Perry St
- 631 E Perry St
- 625 E Perry St
- 643 E Perry St
- 621 E Perry St
- 645 E Perry St
- 331 Klingler Rd
- 701 E Perry St
- 517 E Perry St
- 707 E Perry St
- 319 Klingler Rd
- 609 E Wayne St
- 603 E Wayne St
- 721 E Perry St
- 345 Klingler Rd
- 303 Klingler Rd
- 710 E Perry St
- 520 E Wayne St
- 715 E Wayne St
- 614 E Wayne St
Your Personal Tour Guide
Ask me questions while you tour the home.