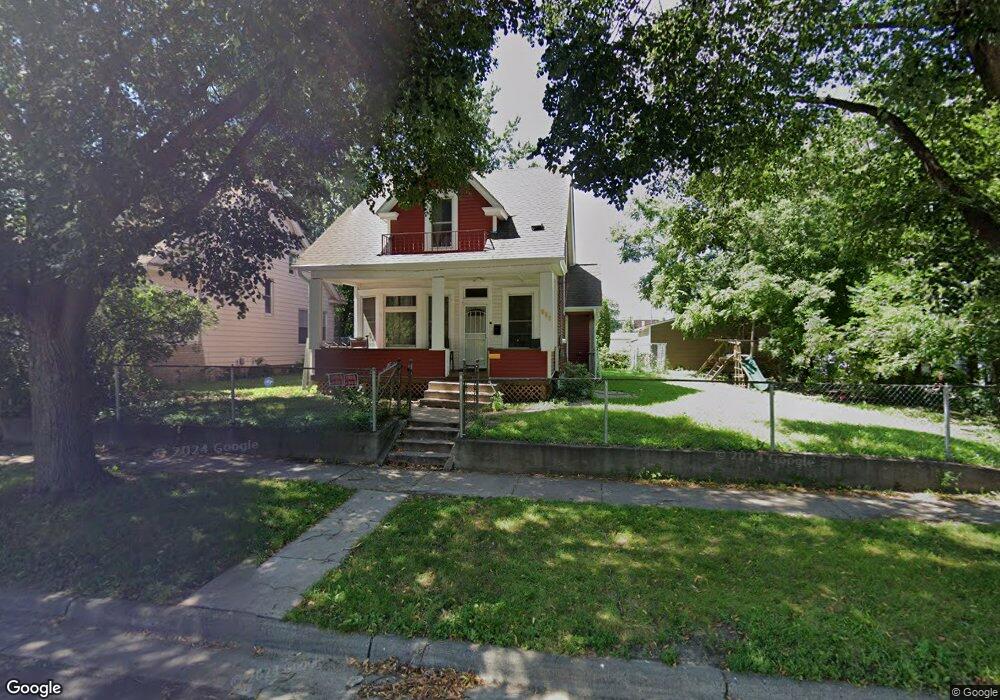
637 Kent St Saint Paul, MN 55103
Frogtown NeighborhoodEstimated Value: $241,472 - $257,000
3
Beds
3
Baths
1,319
Sq Ft
$189/Sq Ft
Est. Value
About This Home
This home is located at 637 Kent St, Saint Paul, MN 55103 and is currently estimated at $249,868, approximately $189 per square foot. 637 Kent St is a home located in Ramsey County with nearby schools including Jackson Elementary, Maxfield Magnet Elementary School, and Hidden River Middle School.
Ownership History
Date
Name
Owned For
Owner Type
Purchase Details
Closed on
Dec 14, 2018
Sold by
Walton Jennifer S
Bought by
Johnson Lareese
Current Estimated Value
Home Financials for this Owner
Home Financials are based on the most recent Mortgage that was taken out on this home.
Original Mortgage
$162,501
Outstanding Balance
$143,453
Interest Rate
4.9%
Mortgage Type
FHA
Estimated Equity
$106,415
Purchase Details
Closed on
Nov 6, 1998
Sold by
Wickenhouser Gary F and Wickenhouser Lynn C
Bought by
Tran Hope and Ngo Nga Thi Huyen
Create a Home Valuation Report for This Property
The Home Valuation Report is an in-depth analysis detailing your home's value as well as a comparison with similar homes in the area
Home Values in the Area
Average Home Value in this Area
Purchase History
| Date | Buyer | Sale Price | Title Company |
|---|---|---|---|
| Johnson Lareese | $165,500 | Minnesota Title | |
| Tran Hope | $47,500 | -- |
Source: Public Records
Mortgage History
| Date | Status | Borrower | Loan Amount |
|---|---|---|---|
| Open | Johnson Lareese | $162,501 |
Source: Public Records
Tax History Compared to Growth
Tax History
| Year | Tax Paid | Tax Assessment Tax Assessment Total Assessment is a certain percentage of the fair market value that is determined by local assessors to be the total taxable value of land and additions on the property. | Land | Improvement |
|---|---|---|---|---|
| 2025 | $3,810 | $241,700 | $25,000 | $216,700 |
| 2023 | $3,810 | $224,000 | $20,000 | $204,000 |
| 2022 | $3,502 | $223,800 | $20,000 | $203,800 |
| 2021 | $3,256 | $197,300 | $20,000 | $177,300 |
| 2020 | $3,088 | $188,100 | $16,600 | $171,500 |
| 2019 | $2,400 | $158,800 | $16,600 | $142,200 |
| 2018 | $1,466 | $93,400 | $16,600 | $76,800 |
| 2017 | $1,524 | $83,400 | $16,600 | $66,800 |
| 2016 | $1,540 | $0 | $0 | $0 |
| 2015 | $1,502 | $64,400 | $16,600 | $47,800 |
| 2014 | $1,502 | $0 | $0 | $0 |
Source: Public Records
Map
Nearby Homes
- 553 Blair Ave
- 547 Blair Ave
- 644 Dale St N
- 534 Thomas Ave
- 511 Van Buren Ave
- 631 Van Buren Ave
- 646 Van Buren Ave
- 566 Edmund Ave
- 653 Thomas Ave
- 553 Charles Ave
- 481 Edmund Ave
- 538 Charles Ave
- 594 Charles Ave
- 610 Charles Ave
- 679 Edmund Ave
- 482 Edmund Ave
- 465 Edmund Ave
- 644 Arundel St
- 679 Charles Ave
- 639 Sherburne Ave