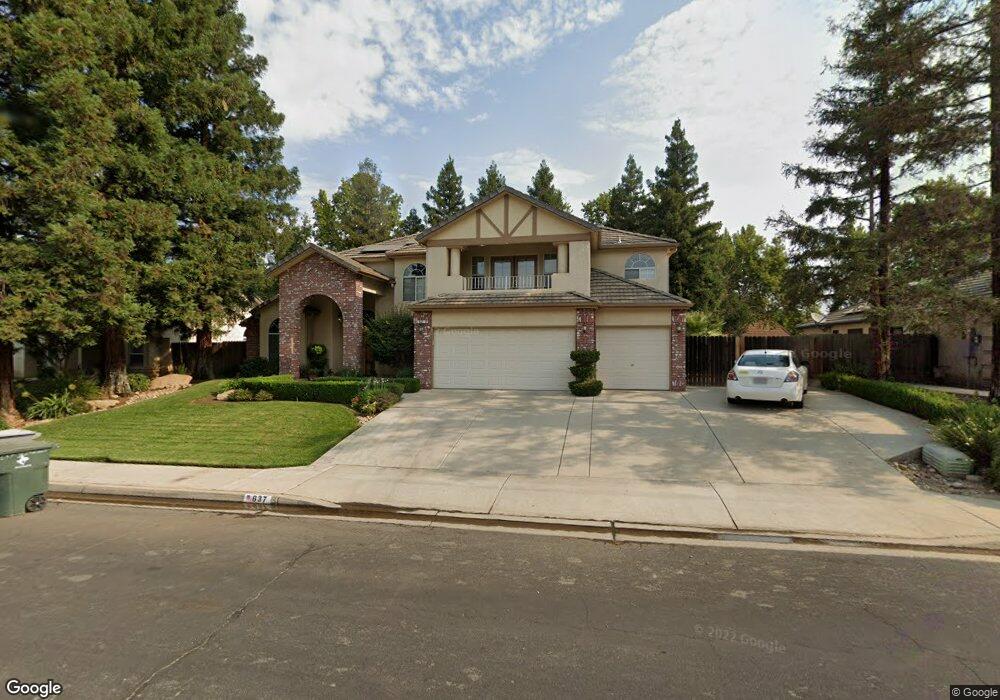
637 W Chennault Ave Clovis, CA 93611
Estimated Value: $668,000 - $700,000
4
Beds
3
Baths
2,807
Sq Ft
$242/Sq Ft
Est. Value
About This Home
This home is located at 637 W Chennault Ave, Clovis, CA 93611 and is currently estimated at $679,944, approximately $242 per square foot. 637 W Chennault Ave is a home located in Fresno County with nearby schools including Garfield Elementary School, Alta Sierra Intermediate School, and Buchanan High School.
Ownership History
Date
Name
Owned For
Owner Type
Purchase Details
Closed on
Aug 15, 2023
Sold by
Snyder Philip K and Snyder Linda
Bought by
2023 Snyder Family Revocable Trust and Snyder
Current Estimated Value
Purchase Details
Closed on
Jan 29, 2020
Sold by
Labotz Scott A and Labotz Mary A
Bought by
Snyder Philip K and Snyder Linda
Home Financials for this Owner
Home Financials are based on the most recent Mortgage that was taken out on this home.
Original Mortgage
$260,000
Interest Rate
3.74%
Mortgage Type
New Conventional
Purchase Details
Closed on
May 19, 1998
Sold by
Oscar Moe Charles and Ozbun Julie Kay
Bought by
Labotz Scott A and Labotz Mary A
Purchase Details
Closed on
Apr 19, 1994
Sold by
Fresno Industrial Park
Bought by
Moe Charles Oscar and Ozbun Moe Julie Kay
Home Financials for this Owner
Home Financials are based on the most recent Mortgage that was taken out on this home.
Original Mortgage
$143,900
Interest Rate
8.53%
Create a Home Valuation Report for This Property
The Home Valuation Report is an in-depth analysis detailing your home's value as well as a comparison with similar homes in the area
Home Values in the Area
Average Home Value in this Area
Purchase History
| Date | Buyer | Sale Price | Title Company |
|---|---|---|---|
| 2023 Snyder Family Revocable Trust | -- | None Listed On Document | |
| Snyder Philip K | -- | None Listed On Document | |
| Snyder Philip K | $455,000 | Chicago Title Company | |
| Labotz Scott A | $220,000 | First American Title Co | |
| Moe Charles Oscar | $180,000 | Chicago Title Company |
Source: Public Records
Mortgage History
| Date | Status | Borrower | Loan Amount |
|---|---|---|---|
| Previous Owner | Snyder Philip K | $260,000 | |
| Previous Owner | Moe Charles Oscar | $143,900 |
Source: Public Records
Tax History
| Year | Tax Paid | Tax Assessment Tax Assessment Total Assessment is a certain percentage of the fair market value that is determined by local assessors to be the total taxable value of land and additions on the property. | Land | Improvement |
|---|---|---|---|---|
| 2025 | $6,359 | $524,664 | $120,298 | $404,366 |
| 2023 | $6,109 | $504,293 | $115,628 | $388,665 |
| 2022 | $6,030 | $468,906 | $113,361 | $355,545 |
| 2021 | $5,551 | $459,713 | $111,139 | $348,574 |
| 2020 | $3,841 | $318,999 | $72,991 | $246,008 |
| 2019 | $3,768 | $312,745 | $71,560 | $241,185 |
| 2018 | $3,687 | $306,613 | $70,157 | $236,456 |
| 2017 | $3,625 | $300,602 | $68,782 | $231,820 |
| 2016 | $3,505 | $294,709 | $67,434 | $227,275 |
| 2015 | $3,439 | $290,284 | $66,422 | $223,862 |
| 2014 | $3,376 | $284,598 | $65,121 | $219,477 |
Source: Public Records
Map
Nearby Homes
- 684 W Chennault Ave
- 602 W Mahogany Ln
- 484 W Balsam Ln
- 450 W Alluvial Ave
- 2991 E Cromwell Ave
- 2669 E Sean Ave
- 2740 E El Paso Ave
- 2625 E Sean Ave
- 351 N Peach Ave
- 2845 E Goshen Ave
- 2658 E Alluvial Ave Unit 120
- 2658 E Alluvial Ave Unit 220
- 2549 E Jenny Ave
- 288 W Magill Ave
- 131 N Terry Ave
- 7236 N Bonadelle Ave
- 7634 N Dearing Ave
- 6706 N Chestnut Ave Unit 118
- 2545 E Goshen Ave
- 7835 N Matus Ave
- 657 W Chennault Ave
- 627 W Chennault Ave
- 667 W Chennault Ave
- 617 W Chennault Ave
- 654 W Chennault Ave
- 664 W Chennault Ave
- 677 W Chennault Ave
- 674 W Chennault Ave
- 674 N Helm Ave
- 621 N Adler Ave
- 687 W Chennault Ave
- 651 W Birch Ave
- 686 N Helm Ave
- 661 W Birch Ave
- 671 W Birch Ave
- 611 N Adler Ave
- 626 N Helm Ave
- 694 W Chennault Ave
- 697 W Chennault Ave
- 681 W Birch Ave
Your Personal Tour Guide
Ask me questions while you tour the home.