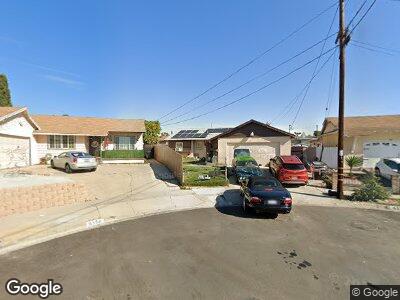
6372 Rhoades Ct San Diego, CA 92139
Paradise Hills NeighborhoodEstimated Value: $642,000 - $800,000
3
Beds
2
Baths
1,157
Sq Ft
$618/Sq Ft
Est. Value
About This Home
This home is located at 6372 Rhoades Ct, San Diego, CA 92139 and is currently estimated at $714,692, approximately $617 per square foot. 6372 Rhoades Ct is a home located in San Diego County with nearby schools including Penn Elementary, Bell Middle School, and Morse High School.
Ownership History
Date
Name
Owned For
Owner Type
Purchase Details
Closed on
Apr 20, 2020
Sold by
Jones Diana Isabel
Bought by
Foster Evan R
Current Estimated Value
Home Financials for this Owner
Home Financials are based on the most recent Mortgage that was taken out on this home.
Original Mortgage
$720,000
Outstanding Balance
$644,448
Interest Rate
3.13%
Mortgage Type
Reverse Mortgage Home Equity Conversion Mortgage
Estimated Equity
$72,425
Purchase Details
Closed on
Aug 6, 2013
Sold by
Foster Janet M
Bought by
Foster Evan R
Purchase Details
Closed on
Oct 25, 2006
Sold by
Foster Rufus E and Foster Janet M
Bought by
Foster Rufus E and Foster Janet M
Home Financials for this Owner
Home Financials are based on the most recent Mortgage that was taken out on this home.
Original Mortgage
$160,000
Interest Rate
6.45%
Mortgage Type
Balloon
Purchase Details
Closed on
Feb 8, 1999
Sold by
Foster Rufus E and Foster Janet M
Bought by
Foster Rufus E and Foster Janet M
Create a Home Valuation Report for This Property
The Home Valuation Report is an in-depth analysis detailing your home's value as well as a comparison with similar homes in the area
Home Values in the Area
Average Home Value in this Area
Purchase History
| Date | Buyer | Sale Price | Title Company |
|---|---|---|---|
| Foster Evan R | -- | None Available | |
| Foster Evan R | -- | None Available | |
| Foster Evan R | -- | None Available | |
| Foster Rufus E | -- | First Southwestern Title Of | |
| Foster Rufus E | -- | -- |
Source: Public Records
Mortgage History
| Date | Status | Borrower | Loan Amount |
|---|---|---|---|
| Open | Foster Evan R | $720,000 | |
| Closed | Foster Evan R | $720,000 | |
| Previous Owner | Foster Rufus E | $160,000 |
Source: Public Records
Tax History Compared to Growth
Tax History
| Year | Tax Paid | Tax Assessment Tax Assessment Total Assessment is a certain percentage of the fair market value that is determined by local assessors to be the total taxable value of land and additions on the property. | Land | Improvement |
|---|---|---|---|---|
| 2024 | $697 | $60,860 | $16,498 | $44,362 |
| 2023 | $679 | $59,668 | $16,175 | $43,493 |
| 2022 | $659 | $58,499 | $15,858 | $42,641 |
| 2021 | $740 | $57,353 | $15,548 | $41,805 |
| 2020 | $731 | $56,766 | $15,389 | $41,377 |
| 2019 | $1,791 | $302,198 | $137,362 | $164,836 |
| 2018 | $4,580 | $296,273 | $134,669 | $161,604 |
| 2017 | $4,476 | $290,465 | $132,029 | $158,436 |
| 2016 | $4,421 | $284,771 | $129,441 | $155,330 |
| 2015 | $4,381 | $280,494 | $127,497 | $152,997 |
| 2014 | $628 | $50,649 | $13,732 | $36,917 |
Source: Public Records
Map
Nearby Homes
- 2750 Landscape Dr
- 6447 Seascape Dr
- 2802 Beatrice St
- 6274 Chadwick Ave
- 2585 Calle Serena
- 2933 Demeter Way
- 2426 Homesite Dr
- 6044 Roanoke St
- 6730 Omega Dr
- 2704 Alta View Dr
- 6912 Camphor Ln
- 6950 Parkside Ave Unit 121
- 6767 Parkside Ave
- 5937-39 Cumberland St
- 6771 Parkside Ave
- 3115 Mount Miguel Dr
- 6880 Bear River Row Unit 1
- 2862 Callejon
- 6808 Quebec Ct Unit 2
- 5758 Roanoke St
- 6372 Rhoades Ct
- 6358 Rhoades Ct
- 6371 Rhoades Ct
- 2732 Beatrice St
- 2722 Beatrice St
- 2742 Beatrice St
- 6363 Clyde Ave
- 6353 Clyde Ave
- 6357 Rhoades Ct
- 6344 Rhoades Ct
- 2712 Beatrice St
- 2752 Beatrice St
- 6343 Clyde Ave
- 6343 Rhoades Ct
- 6368 Dissinger Ave
- 6330 Rhoades Ct
- 6333 Clyde Ave
- 6354 Dissinger Ave
- 2762 Beatrice St
- 2731 Beatrice St