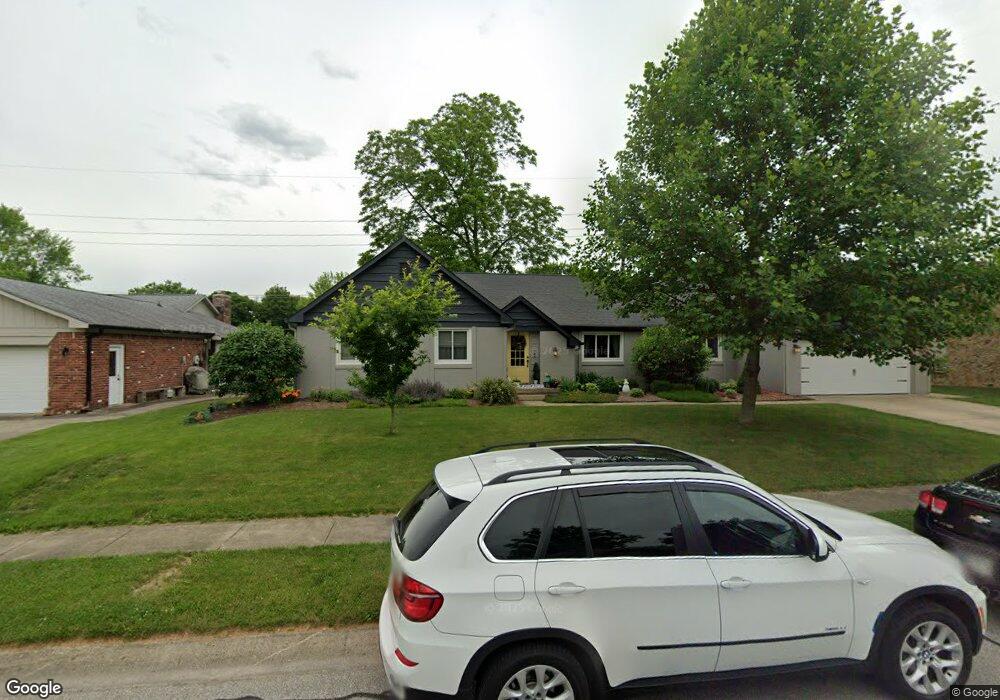
638 Beech Dr W Plainfield, IN 46168
Estimated Value: $347,000 - $411,000
4
Beds
3
Baths
3,636
Sq Ft
$104/Sq Ft
Est. Value
About This Home
This home is located at 638 Beech Dr W, Plainfield, IN 46168 and is currently estimated at $379,690, approximately $104 per square foot. 638 Beech Dr W is a home located in Hendricks County with nearby schools including Clarks Creek Elementary, Plainfield Community Middle School, and Plainfield High School.
Ownership History
Date
Name
Owned For
Owner Type
Purchase Details
Closed on
Dec 28, 2016
Sold by
Nysewander Matthew P and Nysewander Michelle C
Bought by
Smith Ii Roger L and Smith Dana
Current Estimated Value
Home Financials for this Owner
Home Financials are based on the most recent Mortgage that was taken out on this home.
Original Mortgage
$219,428
Outstanding Balance
$181,229
Interest Rate
4.62%
Mortgage Type
FHA
Estimated Equity
$198,461
Purchase Details
Closed on
May 30, 2008
Sold by
Harless Jack and Harless Judy
Bought by
Nysewander Matthew R and Nysewander Michelle C
Home Financials for this Owner
Home Financials are based on the most recent Mortgage that was taken out on this home.
Original Mortgage
$216,601
Interest Rate
6.01%
Mortgage Type
FHA
Create a Home Valuation Report for This Property
The Home Valuation Report is an in-depth analysis detailing your home's value as well as a comparison with similar homes in the area
Home Values in the Area
Average Home Value in this Area
Purchase History
| Date | Buyer | Sale Price | Title Company |
|---|---|---|---|
| Smith Ii Roger L | -- | First American Title | |
| Nysewander Matthew R | -- | None Available |
Source: Public Records
Mortgage History
| Date | Status | Borrower | Loan Amount |
|---|---|---|---|
| Open | Smith Ii Roger L | $219,428 | |
| Previous Owner | Nysewander Matthew R | $216,601 |
Source: Public Records
Tax History
| Year | Tax Paid | Tax Assessment Tax Assessment Total Assessment is a certain percentage of the fair market value that is determined by local assessors to be the total taxable value of land and additions on the property. | Land | Improvement |
|---|---|---|---|---|
| 2025 | $4,011 | $415,300 | $65,000 | $350,300 |
| 2024 | $4,011 | $402,900 | $49,200 | $353,700 |
| 2023 | $3,736 | $383,700 | $46,900 | $336,800 |
| 2022 | $3,191 | $319,100 | $39,100 | $280,000 |
| 2021 | $2,784 | $278,400 | $36,900 | $241,500 |
| 2020 | $2,649 | $264,900 | $36,900 | $228,000 |
| 2019 | $2,629 | $262,900 | $37,000 | $225,900 |
| 2018 | $2,589 | $258,900 | $37,000 | $221,900 |
| 2017 | $2,493 | $249,300 | $37,000 | $212,300 |
| 2016 | $2,401 | $240,100 | $37,000 | $203,100 |
| 2014 | $2,288 | $228,800 | $35,500 | $193,300 |
Source: Public Records
Map
Nearby Homes
- 537 Wayside Ct
- 1734 Beech Cir
- 1713 Sycamore Dr
- 914 Corey Ln
- 2668 Marjorie Ln
- 428 Southmore St
- 920 Walton Dr
- 430 Lawndale Dr
- 324 Lawndale Dr
- 1107 Ridgewood Dr
- 1935 Gladden Rd
- 228 Shaw St
- 942 Highlander Dr
- 2198 Galleone Way
- 7683 Fairwood Blvd
- 1710 Beechwood Dr
- 408 Linden Ln
- 413 Linden Ln
- 2644 Prism Way
- 2654 Prism Way
Your Personal Tour Guide
Ask me questions while you tour the home.