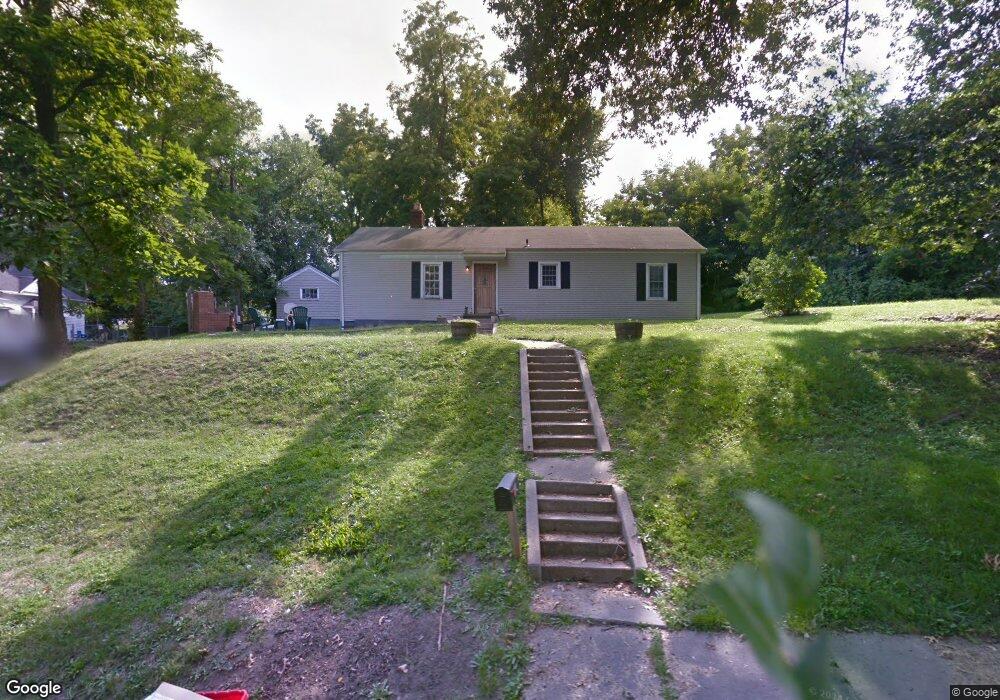
638 Blake St Ottumwa, IA 52501
Estimated Value: $65,000 - $81,000
2
Beds
1
Bath
1,081
Sq Ft
$68/Sq Ft
Est. Value
About This Home
This home is located at 638 Blake St, Ottumwa, IA 52501 and is currently estimated at $73,186, approximately $67 per square foot. 638 Blake St is a home located in Wapello County with nearby schools including Wilson Elementary School, Evans Middle School, and Ottumwa High School.
Ownership History
Date
Name
Owned For
Owner Type
Purchase Details
Closed on
Dec 21, 2020
Sold by
Mcclure Michael P and Mcclure Christine A
Bought by
Seia Rentals Llc
Current Estimated Value
Home Financials for this Owner
Home Financials are based on the most recent Mortgage that was taken out on this home.
Original Mortgage
$15,000
Outstanding Balance
$13,354
Interest Rate
2.7%
Mortgage Type
Commercial
Estimated Equity
$59,832
Purchase Details
Closed on
Apr 30, 2020
Sold by
Mcclure Victor Gregory and Mcclure Gregory V
Bought by
Mcclure Michael P
Home Financials for this Owner
Home Financials are based on the most recent Mortgage that was taken out on this home.
Original Mortgage
$70,364
Interest Rate
3.3%
Mortgage Type
New Conventional
Purchase Details
Closed on
Apr 9, 2014
Sold by
Mcclure Deborah Sue
Bought by
Mcclure Victor Gregory
Create a Home Valuation Report for This Property
The Home Valuation Report is an in-depth analysis detailing your home's value as well as a comparison with similar homes in the area
Home Values in the Area
Average Home Value in this Area
Purchase History
| Date | Buyer | Sale Price | Title Company |
|---|---|---|---|
| Seia Rentals Llc | $15,000 | None Listed On Document | |
| Seia Rentals Llc | $15,000 | None Available | |
| Mcclure Michael P | $15,000 | None Available | |
| Mcclure Victor Gregory | -- | None Available |
Source: Public Records
Mortgage History
| Date | Status | Borrower | Loan Amount |
|---|---|---|---|
| Open | Seia Rentals Llc | $15,000 | |
| Open | Seia Rentals Llc | $50,000 | |
| Previous Owner | Mcclure Michael P | $70,364 |
Source: Public Records
Tax History Compared to Growth
Tax History
| Year | Tax Paid | Tax Assessment Tax Assessment Total Assessment is a certain percentage of the fair market value that is determined by local assessors to be the total taxable value of land and additions on the property. | Land | Improvement |
|---|---|---|---|---|
| 2025 | $1,428 | $71,500 | $10,100 | $61,400 |
| 2024 | $1,428 | $65,830 | $10,100 | $55,730 |
| 2023 | $1,264 | $65,830 | $10,100 | $55,730 |
| 2022 | $1,014 | $52,930 | $10,100 | $42,830 |
| 2021 | $1,015 | $39,960 | $10,100 | $29,860 |
| 2020 | $1,354 | $52,650 | $10,100 | $42,550 |
| 2019 | $1,382 | $52,650 | $0 | $0 |
| 2018 | $1,342 | $52,650 | $0 | $0 |
| 2017 | $1,342 | $52,650 | $0 | $0 |
| 2016 | $1,124 | $44,935 | $0 | $0 |
| 2015 | $1,124 | $44,935 | $0 | $0 |
| 2014 | $1,112 | $44,935 | $0 | $0 |
Source: Public Records
Map
Nearby Homes
- 912 E Fourth St
- 316 E 5th St
- 306 N Fellows Ave
- 231 E Main St
- 721 N Ash St
- 106 N Iowa Ave
- 102 S Van Buren Ave
- 616 Lamborn St
- 144 Lincoln Ave
- 132 Lincoln Ave
- 317 N Walnut Ave
- 1019 E Court St
- 750 N Green St
- 749 N Green St
- 359 N Marion St
- 0 N Madison Ave Unit NOC6331545
- 325 E Maple Ave
- 818 Dewey St
- 129 Cass St
- 209 W Maple Ave