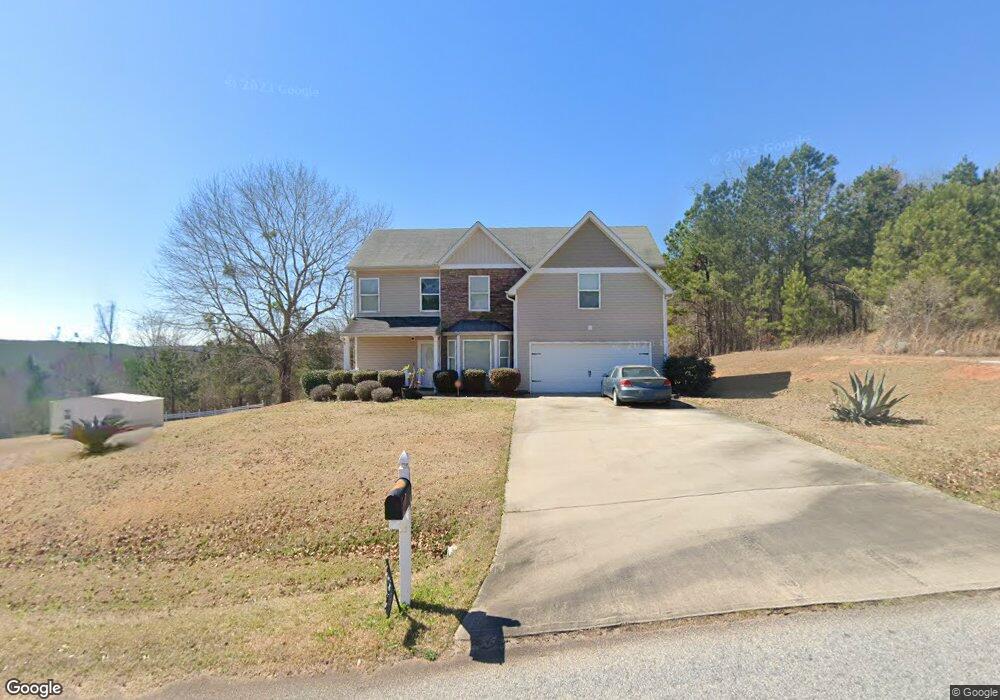
638 Jasmine Dr Macon, GA 31211
Estimated Value: $245,000 - $256,350
--
Bed
1
Bath
1,968
Sq Ft
$127/Sq Ft
Est. Value
About This Home
This home is located at 638 Jasmine Dr, Macon, GA 31211 and is currently estimated at $250,588, approximately $127 per square foot. 638 Jasmine Dr is a home located in Jones County with nearby schools including Mattie Wells Elementary School, Clifton Ridge Middle School, and Jones County High School.
Ownership History
Date
Name
Owned For
Owner Type
Purchase Details
Closed on
Jun 26, 2009
Sold by
Southern Crescent Mtg
Bought by
Andrews Willie L
Current Estimated Value
Purchase Details
Closed on
May 5, 2009
Sold by
Haven Homes Of America
Bought by
Southern Crescent Mtg Investme
Purchase Details
Closed on
Feb 27, 2007
Sold by
Not Provided
Bought by
Andrews Willie L
Home Financials for this Owner
Home Financials are based on the most recent Mortgage that was taken out on this home.
Original Mortgage
$468,375
Interest Rate
6.3%
Mortgage Type
New Conventional
Create a Home Valuation Report for This Property
The Home Valuation Report is an in-depth analysis detailing your home's value as well as a comparison with similar homes in the area
Home Values in the Area
Average Home Value in this Area
Purchase History
| Date | Buyer | Sale Price | Title Company |
|---|---|---|---|
| Andrews Willie L | $133,000 | -- | |
| Southern Crescent Mtg Investme | -- | -- | |
| Southern Crescent Mtg Investme | -- | -- | |
| Andrews Willie L | $1,518,000 | -- |
Source: Public Records
Mortgage History
| Date | Status | Borrower | Loan Amount |
|---|---|---|---|
| Previous Owner | Andrews Willie L | $468,375 |
Source: Public Records
Tax History Compared to Growth
Tax History
| Year | Tax Paid | Tax Assessment Tax Assessment Total Assessment is a certain percentage of the fair market value that is determined by local assessors to be the total taxable value of land and additions on the property. | Land | Improvement |
|---|---|---|---|---|
| 2023 | $2,259 | $66,580 | $9,600 | $56,980 |
| 2022 | $2,134 | $63,091 | $9,600 | $53,491 |
| 2021 | $2,136 | $63,091 | $9,600 | $53,491 |
| 2020 | $2,137 | $63,091 | $9,600 | $53,491 |
| 2019 | $2,137 | $63,091 | $9,600 | $53,491 |
| 2018 | $2,137 | $63,091 | $9,600 | $53,491 |
| 2017 | $2,137 | $63,091 | $9,600 | $53,491 |
| 2016 | $2,137 | $63,091 | $9,600 | $53,491 |
| 2015 | $2,018 | $63,091 | $9,600 | $53,491 |
| 2014 | $1,864 | $63,091 | $9,600 | $53,491 |
Source: Public Records
Map
Nearby Homes
- Birch Plan at Clifton Ridge
- Lane Plan at Clifton Ridge
- Benton Plan at Clifton Ridge
- Duke Plan at Clifton Ridge
- Brooke Plan at Clifton Ridge
- Delilah Plan at Clifton Ridge
- 687 Jasmine Dr
- 699 Jasmine Dr
- 699 Jasmine Dr Unit C48
- 1042 Sun Valley Ct Unit C58
- 3608 Joycliff Rd
- 225 Olivia Cir
- 135 Sun Valley Dr
- 131 Sun Valley Dr
- 227 Dusty Ln
- 118 Oakwood Dr
- 240 Neptune Ct
- 2815 New Clinton Rd
- 3154 Bethune Ave