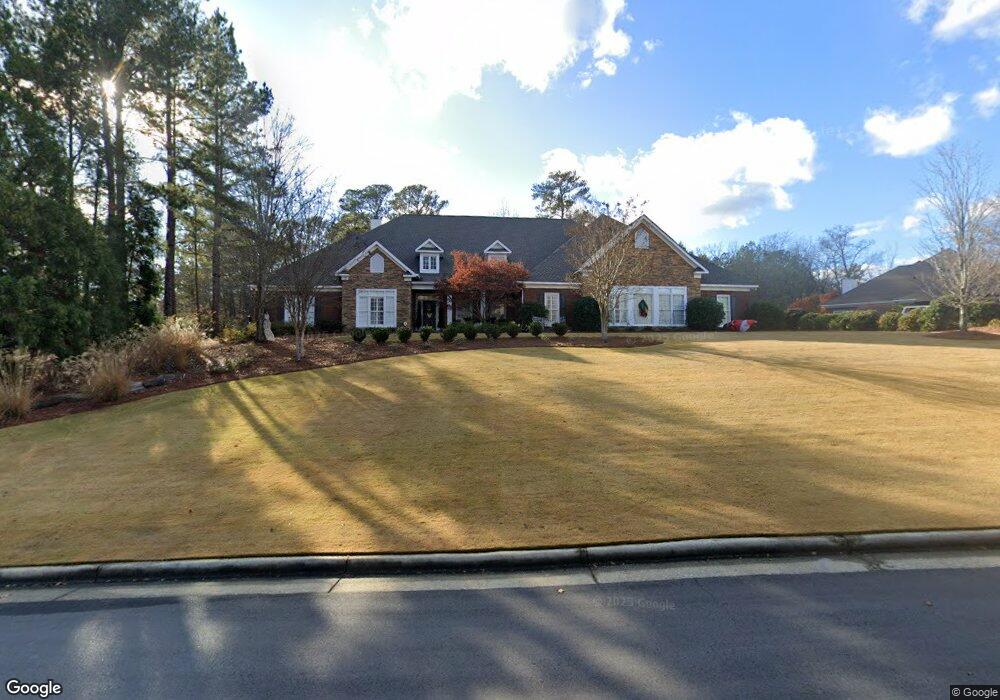
6385 Rivermont Ct Columbus, GA 31904
North Columbus NeighborhoodEstimated Value: $670,000 - $857,000
5
Beds
5
Baths
5,116
Sq Ft
$148/Sq Ft
Est. Value
About This Home
This home is located at 6385 Rivermont Ct, Columbus, GA 31904 and is currently estimated at $756,639, approximately $147 per square foot. 6385 Rivermont Ct is a home located in Muscogee County with nearby schools including River Road Elementary School, Double Churches Middle School, and Northside High School.
Ownership History
Date
Name
Owned For
Owner Type
Purchase Details
Closed on
Jun 15, 2009
Sold by
Wright Jeremy Brent
Bought by
Wright Nancy
Current Estimated Value
Home Financials for this Owner
Home Financials are based on the most recent Mortgage that was taken out on this home.
Original Mortgage
$340,000
Interest Rate
4.77%
Mortgage Type
New Conventional
Purchase Details
Closed on
Jun 9, 2009
Sold by
Wright Nancy
Bought by
Wright Jeremy Brent
Home Financials for this Owner
Home Financials are based on the most recent Mortgage that was taken out on this home.
Original Mortgage
$340,000
Interest Rate
4.77%
Mortgage Type
New Conventional
Create a Home Valuation Report for This Property
The Home Valuation Report is an in-depth analysis detailing your home's value as well as a comparison with similar homes in the area
Home Values in the Area
Average Home Value in this Area
Purchase History
| Date | Buyer | Sale Price | Title Company |
|---|---|---|---|
| Wright Nancy | -- | None Available | |
| Wright Jeremy Brent | -- | None Available |
Source: Public Records
Mortgage History
| Date | Status | Borrower | Loan Amount |
|---|---|---|---|
| Closed | Wright Jeremy Brent | $340,000 |
Source: Public Records
Tax History Compared to Growth
Tax History
| Year | Tax Paid | Tax Assessment Tax Assessment Total Assessment is a certain percentage of the fair market value that is determined by local assessors to be the total taxable value of land and additions on the property. | Land | Improvement |
|---|---|---|---|---|
| 2025 | $10,706 | $273,504 | $40,976 | $232,528 |
| 2024 | $10,706 | $273,504 | $40,976 | $232,528 |
| 2023 | $1,077 | $273,504 | $40,976 | $232,528 |
| 2022 | $8,947 | $219,128 | $40,976 | $178,152 |
| 2021 | $8,734 | $213,904 | $40,976 | $172,928 |
| 2020 | $8,736 | $213,904 | $40,976 | $172,928 |
| 2019 | $8,764 | $213,904 | $40,976 | $172,928 |
| 2018 | $8,764 | $213,904 | $40,976 | $172,928 |
| 2017 | $8,792 | $213,904 | $40,976 | $172,928 |
| 2016 | $10,869 | $263,479 | $24,000 | $239,479 |
| 2015 | $10,882 | $263,479 | $24,000 | $239,479 |
| 2014 | $10,895 | $263,479 | $24,000 | $239,479 |
| 2013 | -- | $263,479 | $24,000 | $239,479 |
Source: Public Records
Map
Nearby Homes
- 6390 Cape Cod Dr
- 5 Bridgecreek Ct
- 235 Pebblebrook Ln
- 6130 Brookstone Blvd
- 6333 Cape Cod Dr
- 6101 River Rd Unit 2
- 6130 Bristol Blvd
- 6688 Creekview Place
- 16 Kylemore Ct
- 7015 Spring Walk Dr
- 280 Zachary Ct
- 616 Newport Place
- 5908 Brookstone Blvd
- 7044 Spring Walk Dr
- 6500 Standing Boy Rd Unit 6
- 6528 Standing Boy Rd
- 252 Woodstream Dr
- 308 Woodstream Dr
- 264 Woodstream Dr
- 315 Woodstream Dr
- 6377 Rivermont Ct
- 6393 Rivermont Ct
- 6390 Rivermont Ct
- 6384 Rivermont Ct
- 6369 Rivermont Ct
- 6396 Rivermont Ct
- 6376 Rivermont Ct
- 6400 Rivermont Ct
- 6368 Rivermont Ct
- 6365 Rivermont Ct
- 6360 Rivermont Ct
- 21 Pinecreek Dr
- 22 Pinecreek Dr
- 6361 Rivermont Ct
- 6417 Fall Branch Dr
- 6421 Fall Branch Dr
- 6352 Rivermont Ct
- 20 Pinecreek Dr
- 6425 Fall Branch Dr
- 6355 Rivermont Ct