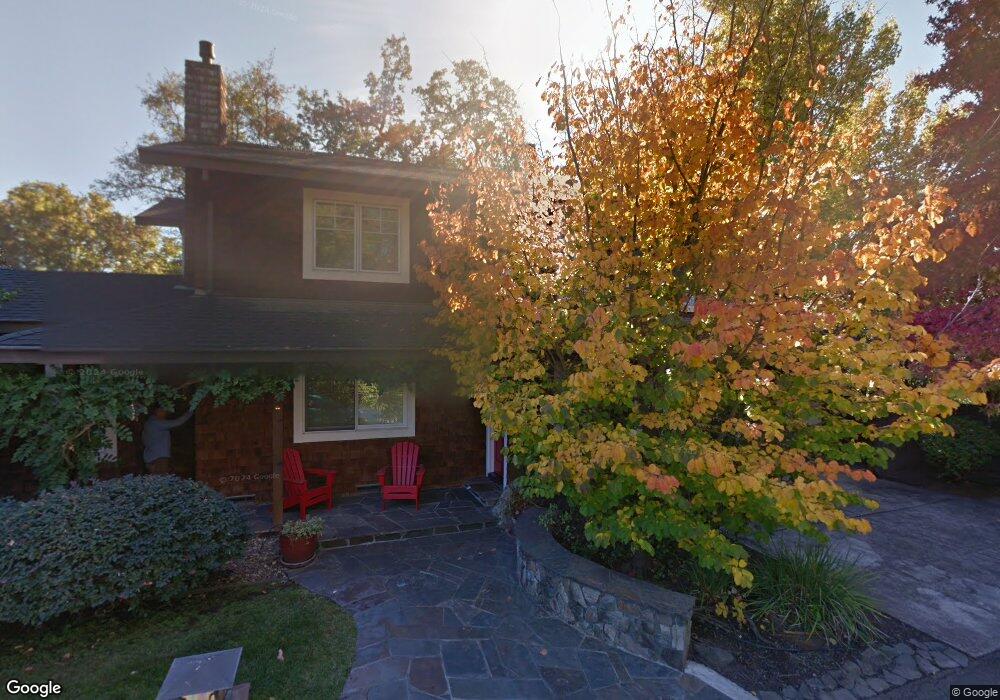
639 4th St E Sonoma, CA 95476
Estimated Value: $1,681,268 - $2,942,000
3
Beds
3
Baths
2,143
Sq Ft
$958/Sq Ft
Est. Value
About This Home
This home is located at 639 4th St E, Sonoma, CA 95476 and is currently estimated at $2,053,067, approximately $958 per square foot. 639 4th St E is a home located in Sonoma County with nearby schools including Prestwood Elementary School, Adele Harrison Middle School, and Creekside High School.
Ownership History
Date
Name
Owned For
Owner Type
Purchase Details
Closed on
Aug 21, 2012
Sold by
Garro Dennis and Garro Jeanne
Bought by
Haahr Paul and Karp Susan
Current Estimated Value
Purchase Details
Closed on
Apr 7, 2004
Sold by
Garro Dennis and Garro Jeanne
Bought by
Garro Dennis and Garro Jeanne
Home Financials for this Owner
Home Financials are based on the most recent Mortgage that was taken out on this home.
Original Mortgage
$550,000
Interest Rate
5.56%
Mortgage Type
Purchase Money Mortgage
Purchase Details
Closed on
Mar 30, 2004
Sold by
Morrison Gary and Morrison Geraldine C
Bought by
Garro Dennis and Garro Jeanne
Home Financials for this Owner
Home Financials are based on the most recent Mortgage that was taken out on this home.
Original Mortgage
$550,000
Interest Rate
5.56%
Mortgage Type
Purchase Money Mortgage
Purchase Details
Closed on
May 12, 1999
Sold by
Lely Dirk and Lely Paula M
Bought by
Morrison Gary and Morrison Geraldine C
Create a Home Valuation Report for This Property
The Home Valuation Report is an in-depth analysis detailing your home's value as well as a comparison with similar homes in the area
Home Values in the Area
Average Home Value in this Area
Purchase History
| Date | Buyer | Sale Price | Title Company |
|---|---|---|---|
| Haahr Paul | $1,165,000 | Fidelity National Title Co | |
| Garro Dennis | -- | -- | |
| Garro Dennis | $870,000 | Fidelity National Title Co | |
| Morrison Gary | $395,000 | Sonoma Title Guaranty Compan |
Source: Public Records
Mortgage History
| Date | Status | Borrower | Loan Amount |
|---|---|---|---|
| Previous Owner | Garro Dennis | $550,000 |
Source: Public Records
Tax History
| Year | Tax Paid | Tax Assessment Tax Assessment Total Assessment is a certain percentage of the fair market value that is determined by local assessors to be the total taxable value of land and additions on the property. | Land | Improvement |
|---|---|---|---|---|
| 2025 | $17,132 | $1,434,603 | $738,852 | $695,751 |
| 2024 | $17,132 | $1,406,474 | $724,365 | $682,109 |
| 2023 | $17,132 | $1,378,897 | $710,162 | $668,735 |
| 2022 | $16,871 | $1,351,861 | $696,238 | $655,623 |
| 2021 | $16,217 | $1,325,355 | $682,587 | $642,768 |
| 2020 | $16,183 | $1,311,766 | $675,588 | $636,178 |
| 2019 | $15,830 | $1,286,046 | $662,342 | $623,704 |
| 2018 | $15,619 | $1,260,830 | $649,355 | $611,475 |
| 2017 | $15,480 | $1,236,109 | $636,623 | $599,486 |
| 2016 | $14,859 | $1,211,873 | $624,141 | $587,732 |
| 2015 | $14,443 | $1,193,670 | $614,766 | $578,904 |
| 2014 | $14,956 | $1,170,289 | $602,724 | $567,565 |
Source: Public Records
Map
Nearby Homes
Your Personal Tour Guide
Ask me questions while you tour the home.