Estimated Value: $271,000 - $309,000
4
Beds
3
Baths
2,475
Sq Ft
$114/Sq Ft
Est. Value
About This Home
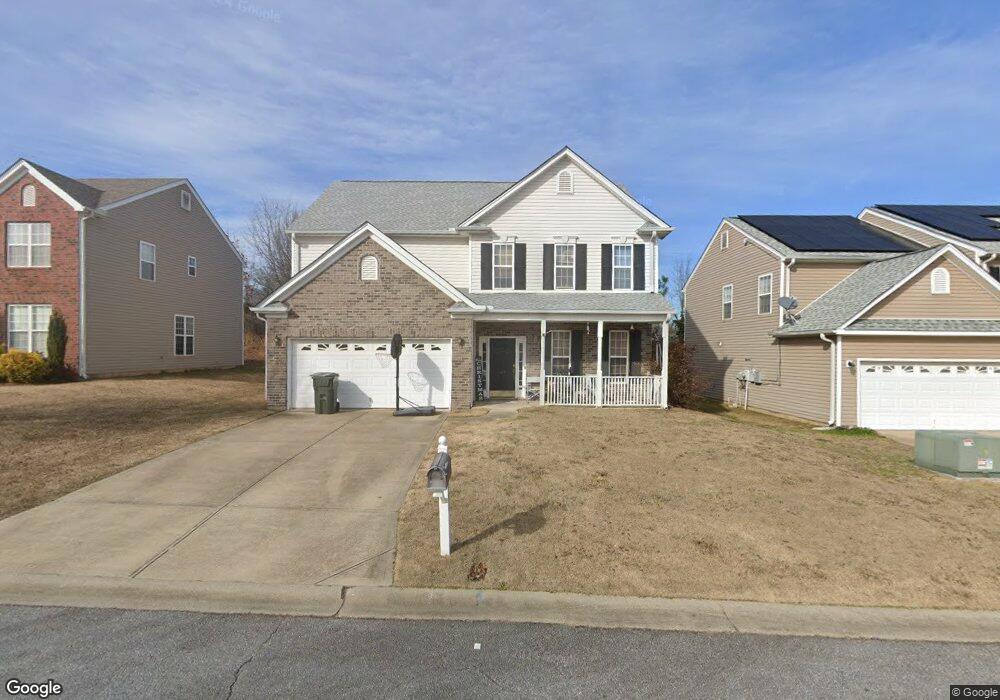
This home is located at 639 Markham Cir, Moore, SC 29369 and is currently estimated at $282,370, approximately $114 per square foot. 639 Markham Cir is a home located in Spartanburg County with nearby schools including Dorman High School Freshman Campus, Dorman High School, and GREEN Charter School Spartanburg.
Ownership History
Date
Name
Owned For
Owner Type
Purchase Details
Closed on
Dec 14, 2012
Sold by
The United States Department Of Housing
Bought by
Shimanskiy Svetlana
Current Estimated Value
Home Financials for this Owner
Home Financials are based on the most recent Mortgage that was taken out on this home.
Original Mortgage
$74,800
Outstanding Balance
$51,775
Interest Rate
3.35%
Mortgage Type
Future Advance Clause Open End Mortgage
Estimated Equity
$230,595
Purchase Details
Closed on
May 26, 2012
Sold by
Deibert Sean M
Bought by
Secretary Of Housing & Urban Development
Purchase Details
Closed on
Jan 11, 2008
Sold by
Lr Development Charlotte Llc
Bought by
Deibert Sean M
Home Financials for this Owner
Home Financials are based on the most recent Mortgage that was taken out on this home.
Original Mortgage
$177,120
Interest Rate
6.06%
Mortgage Type
FHA
Create a Home Valuation Report for This Property
The Home Valuation Report is an in-depth analysis detailing your home's value as well as a comparison with similar homes in the area
Home Values in the Area
Average Home Value in this Area
Purchase History
| Date | Buyer | Sale Price | Title Company |
|---|---|---|---|
| Shimanskiy Svetlana | $93,500 | -- | |
| Secretary Of Housing & Urban Development | $2,500 | -- | |
| Deibert Sean M | $179,900 | Attorney |
Source: Public Records
Mortgage History
| Date | Status | Borrower | Loan Amount |
|---|---|---|---|
| Open | Shimanskiy Svetlana | $74,800 | |
| Previous Owner | Deibert Sean M | $177,120 |
Source: Public Records
Tax History
| Year | Tax Paid | Tax Assessment Tax Assessment Total Assessment is a certain percentage of the fair market value that is determined by local assessors to be the total taxable value of land and additions on the property. | Land | Improvement |
|---|---|---|---|---|
| 2022 | $1,326 | $7,369 | $815 | $6,554 |
| 2021 | $1,326 | $7,369 | $815 | $6,554 |
| 2020 | $1,293 | $7,369 | $815 | $6,554 |
| 2019 | $1,282 | $7,369 | $815 | $6,554 |
| 2018 | $1,271 | $7,369 | $815 | $6,554 |
| 2017 | $1,092 | $6,408 | $840 | $5,568 |
| 2016 | $1,069 | $6,408 | $840 | $5,568 |
| 2015 | $1,078 | $6,408 | $840 | $5,568 |
| 2014 | $1,043 | $6,408 | $840 | $5,568 |
Source: Public Records
Map
Nearby Homes
- 105 Pimmitt Run
- 105 Pimmit Run
- 283 Weston Valley Dr
- 108 Kirkwood Dr
- 754 Markham Cir
- 101 Stockton Ln
- 1732 Constitution Ln
- 1728 Constitution Ln
- 1724 Constitution Ln
- 1820 Betsy Ross Dr
- 1720 Constitution Ln
- 1824 Betsy Ross Dr
- 1716 Constitution Ln
- 1817 Betsy Ross Dr
- 1825 Betsy Ross Dr
- 1821 Betsy Ross Dr
- 1813 Betsy Ross Dr
- 317 E Killarney Lake
- 230 Donegal Dr
- 419 Vestry Place
- 635 Markham Cir
- 631 Markham Cir
- 643 Markham Cir
- 204 Jordan Crest Dr
- 627 Markham Cir
- 234 Weston Valley Dr
- 238 Weston Valley Dr
- 623 Markham Cir
- 232 Weston Valley Dr
- 240 Weston Valley Dr
- 230 Weston Valley Dr
- 647 Markham Cir
- 242 Weston Valley Dr
- 210 Jordan Crest Dr
- 228 Weston Valley Dr
- 109 Pimmitt Run
- 224 Weston Valley Dr
- 651 Markham Cir
- 250 Weston Valley Dr
- 203 Jordan Crest Dr
Your Personal Tour Guide
Ask me questions while you tour the home.