
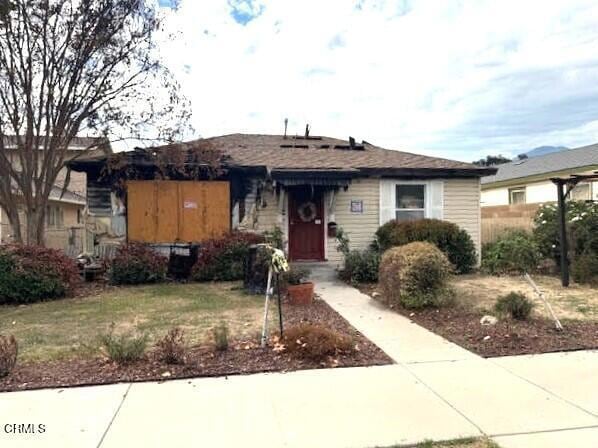
639 Mountain View St Fillmore, CA 93015
Estimated payment $2,604/month
Total Views
1,074
2
Beds
1
Bath
1,136
Sq Ft
$409
Price per Sq Ft
Highlights
- Hot Property
- 2 Car Attached Garage
- Fenced
- No HOA
- Bungalow
- No Heating
About This Home
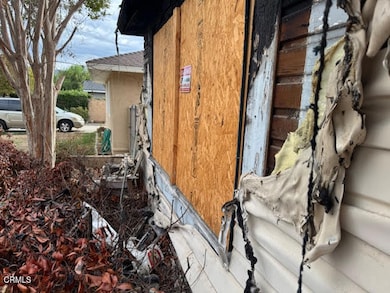
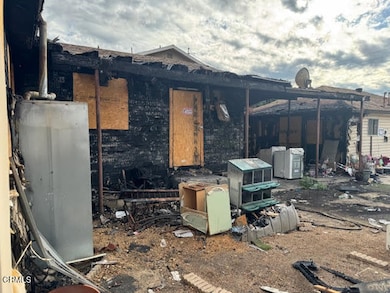
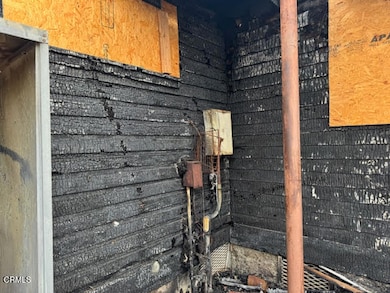
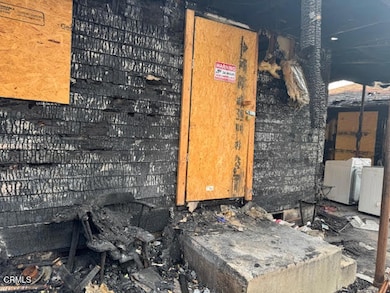
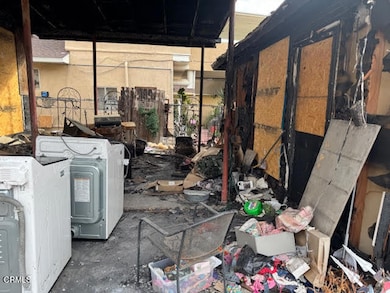
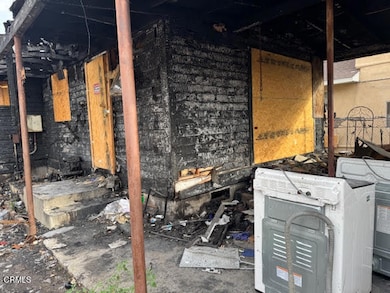
This home is located in a desirable residential neighborhood of Fillmore. It offers an opportunity for investors or buyers seeking a significant renovation project. The home has sustained significant fire damage and will require appropriate repairs or possible demolition and reconstruction. The City has red-tagged the property, and the interior cannot be seen at this time.There is a spacious lot with potential for rebuilding or expansion.Quiet, well-maintained area close to schools, parks, and local amenitiesAttractive setting for a custom home or investment property.Sold as-is. Buyer to verify all aspects of property condition and development potential.
Listing Agent
eXp Realty of California Inc License #00577863 Listed on: 11/15/2025
Home Details
Home Type
- Single Family
Est. Annual Taxes
- $1,775
Year Built
- Built in 1951
Lot Details
- 6,969 Sq Ft Lot
- Fenced
- No Sprinklers
Parking
- 2 Car Attached Garage
- Parking Available
Home Design
- Bungalow
Interior Spaces
- 1,136 Sq Ft Home
- 1-Story Property
Bedrooms and Bathrooms
- 2 Bedrooms
- 1 Full Bathroom
Utilities
- No Heating
Community Details
- No Home Owners Association
Listing and Financial Details
- Assessor Parcel Number 0500194050
- Seller Considering Concessions
Map
Create a Home Valuation Report for This Property
The Home Valuation Report is an in-depth analysis detailing your home's value as well as a comparison with similar homes in the area
Home Values in the Area
Average Home Value in this Area
Tax History
| Year | Tax Paid | Tax Assessment Tax Assessment Total Assessment is a certain percentage of the fair market value that is determined by local assessors to be the total taxable value of land and additions on the property. | Land | Improvement |
|---|---|---|---|---|
| 2025 | $1,775 | $163,621 | $68,346 | $95,275 |
| 2024 | $1,775 | $160,413 | $67,006 | $93,407 |
| 2023 | $1,750 | $157,268 | $65,692 | $91,576 |
| 2022 | $1,618 | $154,185 | $64,404 | $89,781 |
| 2021 | $1,834 | $151,162 | $63,141 | $88,021 |
| 2020 | $1,702 | $149,614 | $62,495 | $87,119 |
| 2019 | $1,706 | $146,681 | $61,270 | $85,411 |
| 2018 | $1,671 | $143,806 | $60,069 | $83,737 |
| 2017 | $1,679 | $140,988 | $58,892 | $82,096 |
| 2016 | $1,556 | $138,225 | $57,738 | $80,487 |
| 2015 | $1,511 | $136,151 | $56,872 | $79,279 |
| 2014 | $1,509 | $133,486 | $55,759 | $77,727 |
Source: Public Records
Property History
| Date | Event | Price | List to Sale | Price per Sq Ft |
|---|---|---|---|---|
| 11/15/2025 11/15/25 | For Sale | $465,000 | -- | $409 / Sq Ft |
Source: Ventura County Regional Data Share
Purchase History
| Date | Type | Sale Price | Title Company |
|---|---|---|---|
| Interfamily Deed Transfer | -- | Timios Inc | |
| Interfamily Deed Transfer | -- | Title365 Company | |
| Interfamily Deed Transfer | -- | None Available | |
| Interfamily Deed Transfer | $174,000 | Fidelity National Title Co | |
| Interfamily Deed Transfer | -- | -- |
Source: Public Records
Mortgage History
| Date | Status | Loan Amount | Loan Type |
|---|---|---|---|
| Closed | $337,810 | FHA | |
| Closed | $216,600 | New Conventional | |
| Closed | $154,000 | No Value Available |
Source: Public Records
About the Listing Agent
Kay has been in full-time real estate since 1976. She is certified competent in many areas of real estate. She is known for her commitment to working early and late and her very hands-on management style. She remains the “first phone” on every transaction, and her market area is comfortably in Ventura County. She has specialties in ranches and land, historic homes, seniors’ real estate, and probate sales. She is a Certified Divorce Consultant, helping people navigate the waters of
Kay's Other Listings
Source: Ventura County Regional Data Share
MLS Number: V1-33417
APN: 050-0-194-050
Disclaimer: Certain information contained herein is derived from information provided by parties other than Homes.com. All information provided is deemed reliable, but is not guaranteed to be accurate and should be independently verified.
![]() IDX information is provided exclusively for personal, non-commercial use, and may not be used for any purpose other than to identify prospective properties consumers may be interested in purchasing. Information is deemed reliable but not guaranteed.
IDX information is provided exclusively for personal, non-commercial use, and may not be used for any purpose other than to identify prospective properties consumers may be interested in purchasing. Information is deemed reliable but not guaranteed.
Nearby Homes
- 0 Fillmore St
- 404 Central Ave
- 809 Woodgrove Rd
- 340 Central Ave
- 330 Buttercup St
- 199 Rosewood St
- 803 Sespe Ave
- 81 Wildwood Ln
- 74 Teakwood St
- 89 Willow St
- 309 Heritage Valley Pkwy
- 513 Heritage Valley Pkwy
- 915 E Telegraph Rd
- 621 Lemon Way
- 250 E Telegraph Rd Unit 68
- 250 E Telegraph Rd Unit 135
- 250 E Telegraph Rd Unit 213
- 250 E Telegraph Rd Unit 224
- 250 E Telegraph Rd Unit 184
- 250 E Telegraph Rd Unit 223
- 510 Central Ave
- 3021 Grand Ave
- 8451 Roseland Ave
- 11972 Broadway Rd
- 7216 Littler Ct
- 12390 Nelson Rd
- 7124 Baneberry Ave
- 13687 Blue Ridge Way
- 14810 Blue Ridge Ct
- 14353 Loyola St
- 2034 Tangelo Way
- 15437 Braun Ct
- 15479 Doris Ct
- 15290 Bambi Ct
- 226 E High St
- 6492 Melray St
- 600 N Spring Rd
- 633 New Los Angeles Ave
- 51 Majestic Ct
- 4736 Talmadge Rd