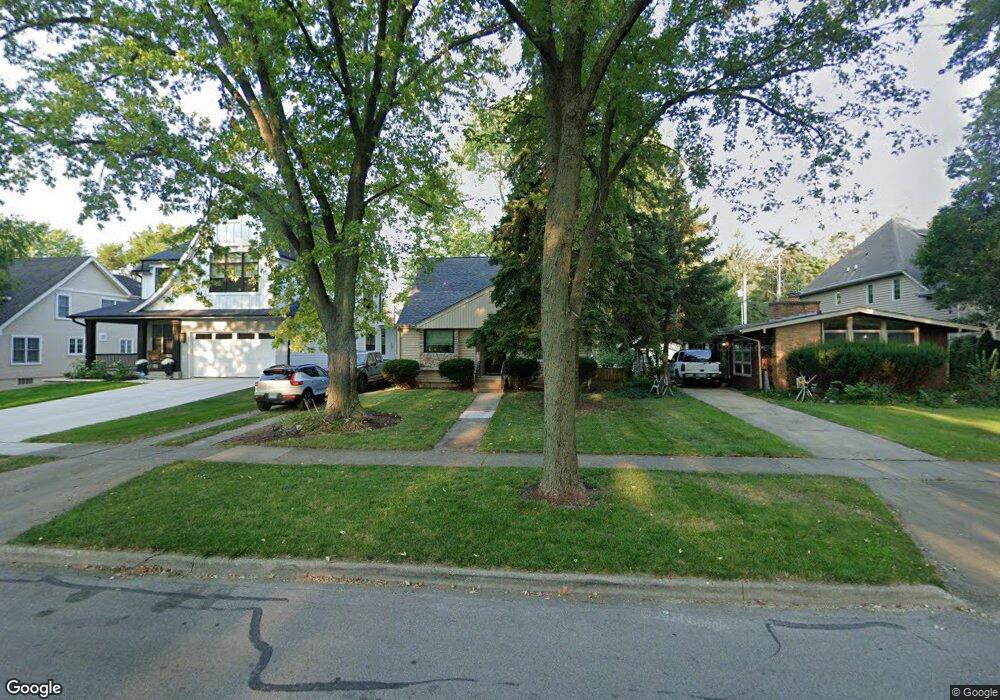
639 N Main St Naperville, IL 60563
North Downtown Naperville NeighborhoodEstimated Value: $507,086 - $676,000
3
Beds
2
Baths
1,440
Sq Ft
$388/Sq Ft
Est. Value
About This Home
This home is located at 639 N Main St, Naperville, IL 60563 and is currently estimated at $559,272, approximately $388 per square foot. 639 N Main St is a home located in DuPage County with nearby schools including Naper Elementary School, Washington Jr High School, and Naperville North High School.
Ownership History
Date
Name
Owned For
Owner Type
Purchase Details
Closed on
Jan 25, 2022
Sold by
Callen David E
Bought by
Callen David E and Larsen Joann
Current Estimated Value
Home Financials for this Owner
Home Financials are based on the most recent Mortgage that was taken out on this home.
Original Mortgage
$273,000
Outstanding Balance
$217,207
Interest Rate
2.63%
Mortgage Type
New Conventional
Estimated Equity
$342,066
Purchase Details
Closed on
Jan 31, 2001
Sold by
Vantiem Reed C and Vantiem Jill M
Bought by
Callen David E
Home Financials for this Owner
Home Financials are based on the most recent Mortgage that was taken out on this home.
Original Mortgage
$208,000
Interest Rate
7.18%
Mortgage Type
Purchase Money Mortgage
Purchase Details
Closed on
Mar 6, 1998
Sold by
Wastel Steven R and Wastel Ervin A
Bought by
Vantiem Reed C and Vantiem Jill M
Home Financials for this Owner
Home Financials are based on the most recent Mortgage that was taken out on this home.
Original Mortgage
$127,800
Interest Rate
7.14%
Mortgage Type
Purchase Money Mortgage
Create a Home Valuation Report for This Property
The Home Valuation Report is an in-depth analysis detailing your home's value as well as a comparison with similar homes in the area
Home Values in the Area
Average Home Value in this Area
Purchase History
| Date | Buyer | Sale Price | Title Company |
|---|---|---|---|
| Callen David E | -- | Ravenswood Title | |
| Callen David E | $220,000 | -- | |
| Vantiem Reed C | $142,000 | Law Title Pick Up |
Source: Public Records
Mortgage History
| Date | Status | Borrower | Loan Amount |
|---|---|---|---|
| Open | Callen David E | $273,000 | |
| Previous Owner | Callen David E | $208,000 | |
| Previous Owner | Vantiem Reed C | $127,800 |
Source: Public Records
Tax History Compared to Growth
Tax History
| Year | Tax Paid | Tax Assessment Tax Assessment Total Assessment is a certain percentage of the fair market value that is determined by local assessors to be the total taxable value of land and additions on the property. | Land | Improvement |
|---|---|---|---|---|
| 2024 | $8,917 | $153,402 | $104,123 | $49,279 |
| 2023 | $8,425 | $137,840 | $93,560 | $44,280 |
| 2022 | $8,035 | $130,360 | $88,140 | $42,220 |
| 2021 | $7,749 | $125,700 | $84,990 | $40,710 |
| 2020 | $7,724 | $125,700 | $84,990 | $40,710 |
| 2019 | $7,443 | $119,550 | $80,830 | $38,720 |
| 2018 | $7,222 | $116,330 | $77,680 | $38,650 |
| 2017 | $7,071 | $112,390 | $75,050 | $37,340 |
| 2016 | $6,895 | $107,850 | $72,020 | $35,830 |
| 2015 | $6,853 | $102,400 | $68,380 | $34,020 |
| 2014 | $6,347 | $92,630 | $61,610 | $31,020 |
| 2013 | $6,304 | $93,270 | $62,040 | $31,230 |
Source: Public Records
Map
Nearby Homes
- 660 N Eagle St
- 905 N Webster St
- 815 N Ellsworth St
- 719 N Brainard St
- 715 N Brainard St
- 717 N Brainard St
- 243 Box Car Ave
- 326 E 4th Ave
- 328 E 4th Ave
- 1016 N Mill St Unit 5
- 837 N Loomis St
- 636 E 4th Ave
- 1104 N Mill St Unit 205
- 1142 N Webster St
- 225 N Mill St
- 316 N Loomis St
- 930 N Loomis St
- 1310 Eagle St
- 1229 Suffolk St
- 1314 N Eagle St