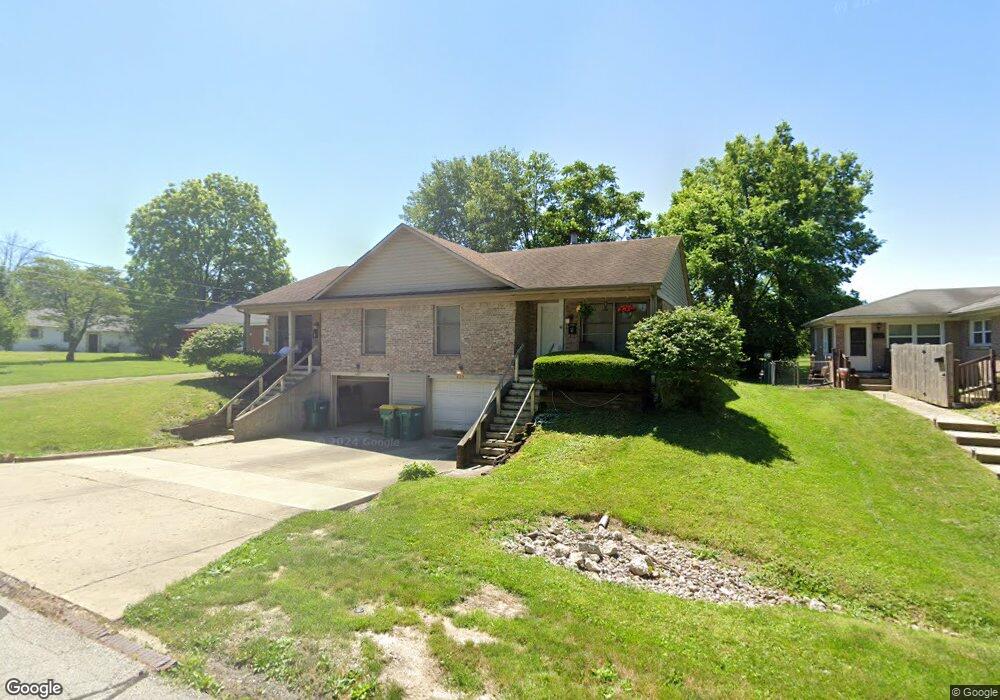
639 Poplar St Plainfield, IN 46168
Estimated Value: $211,000 - $274,000
--
Bed
1
Bath
1,832
Sq Ft
$132/Sq Ft
Est. Value
About This Home
This home is located at 639 Poplar St, Plainfield, IN 46168 and is currently estimated at $241,581, approximately $131 per square foot. 639 Poplar St is a home located in Hendricks County with nearby schools including Van Buren Elementary School, Plainfield Community Middle School, and Plainfield High School.
Ownership History
Date
Name
Owned For
Owner Type
Purchase Details
Closed on
Jan 28, 2011
Sold by
Stewart Robert K and Stewart Shawn R
Bought by
Smith Brandon J
Current Estimated Value
Home Financials for this Owner
Home Financials are based on the most recent Mortgage that was taken out on this home.
Original Mortgage
$116,958
Outstanding Balance
$79,918
Interest Rate
4.75%
Mortgage Type
FHA
Estimated Equity
$161,663
Purchase Details
Closed on
Aug 2, 2010
Sold by
Us Bank National Association
Bought by
Stewart Robert K and Stewart Shawn R
Purchase Details
Closed on
Jun 17, 2010
Sold by
Lewis Paul
Bought by
Us Bank National Association
Purchase Details
Closed on
Jul 17, 2006
Sold by
Hilligoss Thomas F and Hilligoss Dolly R
Bought by
Lewis Paul
Home Financials for this Owner
Home Financials are based on the most recent Mortgage that was taken out on this home.
Original Mortgage
$25,200
Interest Rate
6.73%
Mortgage Type
New Conventional
Create a Home Valuation Report for This Property
The Home Valuation Report is an in-depth analysis detailing your home's value as well as a comparison with similar homes in the area
Home Values in the Area
Average Home Value in this Area
Purchase History
| Date | Buyer | Sale Price | Title Company |
|---|---|---|---|
| Smith Brandon J | -- | None Available | |
| Stewart Robert K | -- | None Available | |
| Us Bank National Association | $93,750 | None Available | |
| Lewis Paul | -- | None Available |
Source: Public Records
Mortgage History
| Date | Status | Borrower | Loan Amount |
|---|---|---|---|
| Open | Smith Brandon J | $116,958 | |
| Previous Owner | Lewis Paul | $25,200 |
Source: Public Records
Tax History Compared to Growth
Tax History
| Year | Tax Paid | Tax Assessment Tax Assessment Total Assessment is a certain percentage of the fair market value that is determined by local assessors to be the total taxable value of land and additions on the property. | Land | Improvement |
|---|---|---|---|---|
| 2024 | $5,093 | $262,600 | $21,400 | $241,200 |
| 2023 | $5,102 | $256,000 | $20,400 | $235,600 |
| 2022 | $4,822 | $241,400 | $19,200 | $222,200 |
| 2021 | $4,366 | $218,300 | $18,700 | $199,600 |
| 2020 | $3,846 | $192,300 | $18,700 | $173,600 |
| 2019 | $3,716 | $185,800 | $13,800 | $172,000 |
| 2018 | $3,612 | $180,600 | $13,800 | $166,800 |
| 2017 | $3,560 | $178,000 | $13,400 | $164,600 |
| 2016 | $3,488 | $174,400 | $13,400 | $161,000 |
| 2014 | $3,370 | $168,500 | $12,300 | $156,200 |
Source: Public Records
Map
Nearby Homes
- 637 Poplar St
- 637 Poplar St
- 637 Poplar St
- 643 Poplar St
- 640 E Main St
- 640 Poplar St
- 638 Poplar St
- 626 E Main St
- 650 Poplar St
- 652 E Main St Unit 4
- 652 E Main St Unit 8
- 652 E Main St Unit 2
- 652 E Main St Unit 2
- 652 E Main Unit 8 St
- 652 (UNIT 2) E Main St Unit 2
- 203 Spring St
- 221 Spring St
- 103 Duffey St
- 641 Spruce St