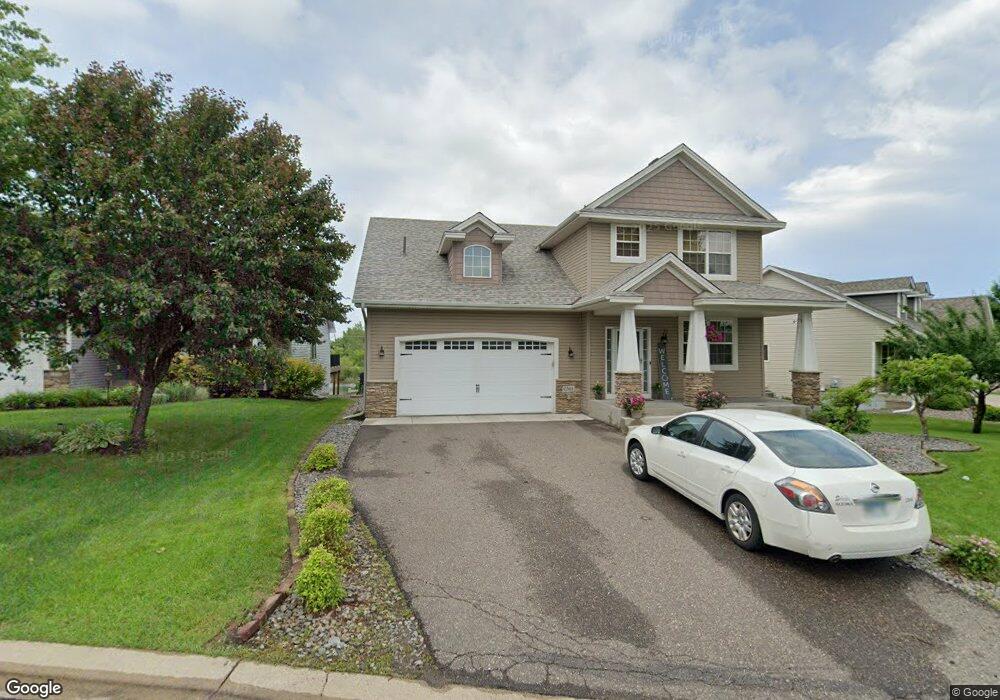
6391 Bakken St Monticello, MN 55362
Estimated Value: $435,000 - $517,000
4
Beds
4
Baths
3,336
Sq Ft
$145/Sq Ft
Est. Value
About This Home
This home is located at 6391 Bakken St, Monticello, MN 55362 and is currently estimated at $483,671, approximately $144 per square foot. 6391 Bakken St is a home located in Wright County with nearby schools including Little Mountain Elementary School, Monticello Middle School, and Monticello Senior High School.
Ownership History
Date
Name
Owned For
Owner Type
Purchase Details
Closed on
Jun 21, 2021
Sold by
Binnie Peter Lars and Binnie Carrie Lyn
Bought by
Mbong Thora and Ebude Evelyn
Current Estimated Value
Home Financials for this Owner
Home Financials are based on the most recent Mortgage that was taken out on this home.
Original Mortgage
$360,000
Outstanding Balance
$325,935
Interest Rate
2.9%
Mortgage Type
New Conventional
Estimated Equity
$157,736
Purchase Details
Closed on
Jun 30, 2015
Sold by
Bainey Charles Charles
Bought by
Binnie Peter Peter
Home Financials for this Owner
Home Financials are based on the most recent Mortgage that was taken out on this home.
Original Mortgage
$235,920
Interest Rate
4.02%
Purchase Details
Closed on
Oct 28, 2005
Sold by
Minks Enterprises Inc
Bought by
Bainey Charles E and Bainey Meredith J
Purchase Details
Closed on
Jun 28, 2005
Sold by
Shadow Creek Corp
Bought by
Minks Enterprises Inc
Create a Home Valuation Report for This Property
The Home Valuation Report is an in-depth analysis detailing your home's value as well as a comparison with similar homes in the area
Home Values in the Area
Average Home Value in this Area
Purchase History
| Date | Buyer | Sale Price | Title Company |
|---|---|---|---|
| Mbong Thora | $400,000 | Title Smart Inc | |
| Binnie Peter Peter | $294,900 | -- | |
| Bainey Charles E | $311,237 | -- | |
| Minks Enterprises Inc | $44,000 | -- | |
| Mbong Thora Thora | $400,000 | -- |
Source: Public Records
Mortgage History
| Date | Status | Borrower | Loan Amount |
|---|---|---|---|
| Open | Mbong Thora | $360,000 | |
| Previous Owner | Binnie Peter Peter | $235,920 | |
| Closed | Mbong Thora Thora | $355,692 |
Source: Public Records
Tax History Compared to Growth
Tax History
| Year | Tax Paid | Tax Assessment Tax Assessment Total Assessment is a certain percentage of the fair market value that is determined by local assessors to be the total taxable value of land and additions on the property. | Land | Improvement |
|---|---|---|---|---|
| 2025 | $4,846 | $474,800 | $95,000 | $379,800 |
| 2024 | $4,866 | $463,700 | $90,000 | $373,700 |
| 2023 | $4,482 | $483,100 | $95,000 | $388,100 |
| 2022 | $3,962 | $424,600 | $85,000 | $339,600 |
| 2021 | $3,880 | $349,800 | $60,000 | $289,800 |
| 2020 | $3,786 | $341,700 | $55,000 | $286,700 |
| 2019 | $3,768 | $332,300 | $0 | $0 |
| 2018 | $3,236 | $316,200 | $0 | $0 |
| 2017 | $3,082 | $293,400 | $0 | $0 |
| 2016 | $2,970 | $0 | $0 | $0 |
| 2015 | $2,838 | $0 | $0 | $0 |
| 2014 | -- | $0 | $0 | $0 |
Source: Public Records
Map
Nearby Homes
- xxx Jason Ave NE
- 8468 Gateway Cir
- 6185 Bakken St
- 6145 Deer St
- 6426 84th St NE
- 6190 Wildwood Way
- 6037 Bakken St
- 8737 Troy Marquette Ln
- 6008 Badger St
- 5882 Deer St
- 6682 E Oak Dr
- 2484 Briar Oakes Blvd
- 6827 Gingham Ct
- 9169 Golden Pond Ln
- 5185 87th St NE
- 5205 87th St NE
- 5789 Mount Curve Blvd
- 9050 Oriole Ln
- 9151 Pelican Ln
- 9351 Golden Pond Ln N
- 8635 Gatewater Dr
- 6367 Bakken St
- 8641 Gatewater Dr
- 6359 Bakken St
- 6347 Bakken St
- 6364 Bakken St
- 8643 Gatewater Dr
- 8605 Gatewater Dr
- 6337 Bakken St
- 6346 Bakken St
- 8608 Gatewater Dr
- 8592 Gatewater Dr
- 8595 Gatewater Dr
- 6336 Bakken St
- 8575 Gateway Cir
- 8577 Gateway Cir
- 8573 Gateway Cir
- 8581 Gateway Cir
- 8661 Gatewater Dr
- 6317 Bakken St