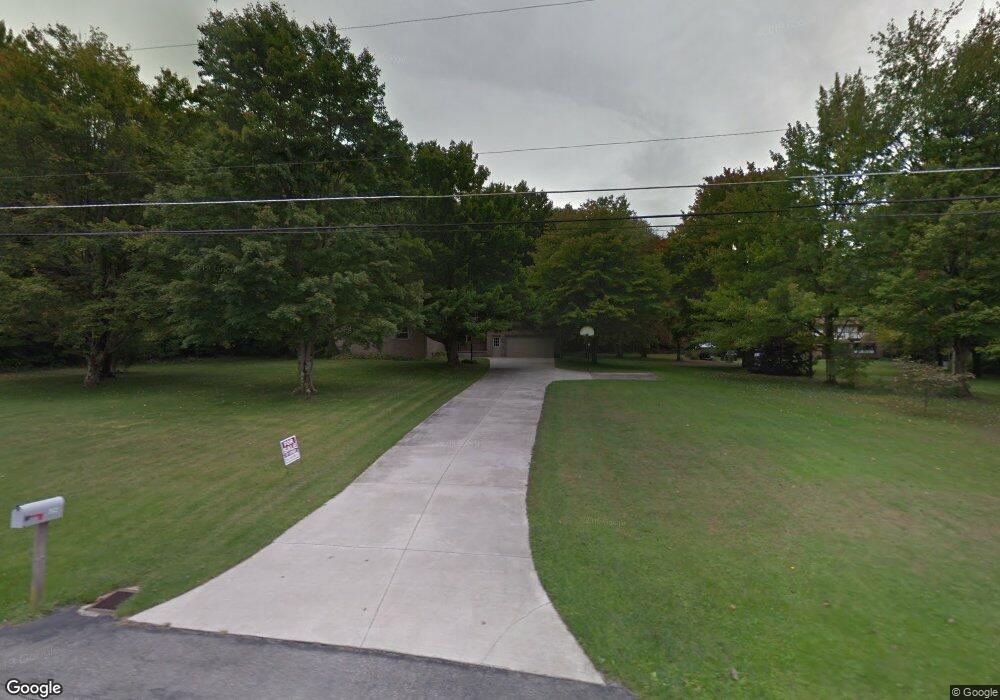
6394 Spencer Clark Rd Fowler, OH 44418
Estimated Value: $268,621 - $315,000
3
Beds
2
Baths
1,816
Sq Ft
$160/Sq Ft
Est. Value
About This Home
This home is located at 6394 Spencer Clark Rd, Fowler, OH 44418 and is currently estimated at $290,405, approximately $159 per square foot. 6394 Spencer Clark Rd is a home located in Trumbull County with nearby schools including Badger Elementary School, Badger Middle School, and Badger High School.
Ownership History
Date
Name
Owned For
Owner Type
Purchase Details
Closed on
Aug 5, 2019
Sold by
Roberts Richard L
Bought by
Roberts Richard L and Bundy Vivian D
Current Estimated Value
Purchase Details
Closed on
Sep 14, 2018
Sold by
Smith Lindsay C and Smith Carla E
Bought by
Roberts Richard L
Home Financials for this Owner
Home Financials are based on the most recent Mortgage that was taken out on this home.
Original Mortgage
$182,631
Interest Rate
5.5%
Mortgage Type
FHA
Purchase Details
Closed on
Jan 1, 1990
Bought by
Lindsay C Smith
Create a Home Valuation Report for This Property
The Home Valuation Report is an in-depth analysis detailing your home's value as well as a comparison with similar homes in the area
Home Values in the Area
Average Home Value in this Area
Purchase History
| Date | Buyer | Sale Price | Title Company |
|---|---|---|---|
| Roberts Richard L | -- | None Available | |
| Roberts Richard L | $186,000 | None Available | |
| Lindsay C Smith | -- | -- |
Source: Public Records
Mortgage History
| Date | Status | Borrower | Loan Amount |
|---|---|---|---|
| Previous Owner | Roberts Richard L | $182,631 |
Source: Public Records
Tax History Compared to Growth
Tax History
| Year | Tax Paid | Tax Assessment Tax Assessment Total Assessment is a certain percentage of the fair market value that is determined by local assessors to be the total taxable value of land and additions on the property. | Land | Improvement |
|---|---|---|---|---|
| 2024 | $3,195 | $74,450 | $10,850 | $63,600 |
| 2023 | $3,195 | $74,450 | $10,850 | $63,600 |
| 2022 | $2,994 | $63,000 | $9,870 | $53,130 |
| 2021 | $2,995 | $63,000 | $9,870 | $53,130 |
| 2020 | $3,015 | $63,000 | $9,870 | $53,130 |
| 2019 | $2,816 | $55,340 | $9,140 | $46,200 |
| 2018 | $2,822 | $55,340 | $9,140 | $46,200 |
| 2017 | $2,815 | $55,340 | $9,140 | $46,200 |
| 2016 | $2,617 | $51,740 | $9,140 | $42,600 |
| 2015 | $2,512 | $51,740 | $9,140 | $42,600 |
| 2014 | $2,511 | $51,740 | $9,140 | $42,600 |
| 2013 | $2,635 | $51,740 | $9,140 | $42,600 |
Source: Public Records
Map
Nearby Homes
- 4016 State Route 7
- 3164 Ohio 7
- 8084 State Route 609
- 7131 Drake Stateline Rd NE
- 7155 Drake State Line Rd
- 2486 Waynewood Dr NE
- 2728 Sodom Hutchings Rd
- 7529 State Line
- 6027 Ohio 88
- 6261 State Route 88
- 4875 Cadwallader-Sonk Rd
- 5626 Stoddard Hayes Rd
- 5329 Tamarack Dr
- 5961 Sodom Hutchings Rd
- 7974 Thompson Sharpsville Rd
- 8038 Thompson Sharpsville Rd
- 6521 State Route 7
- 8274 Thompson Sharpsville Rd
- 1921 Custer Orangeville Rd
- 2009 Sodom Hutchings Rd NE
- 6378 Spencer Clark Rd
- 6422 Spencer Clark Rd
- 6334 Spencer Clark Rd
- 6456 Spencer Clark Rd
- 6294 Spencer Clark Rd
- 6539 Spencer Clark Rd
- 6244 Spencer Clark Rd
- 6254 Spencer Clark Rd
- 6545 Spencer Clark Rd
- 6551 Spencer Clark Rd
- 6224 Spencer Clark Rd
- 6569 Spencer Clark Rd
- 6601 Spencer Clark Rd
- 0 Spencer Clark Rd
- 6154 Spencer Clark Rd
- 4060 Bushnell Campbell Rd
- 4034 Bushnell Campbell Rd
- 4145 Bushnell Campbell Rd
- 6668 Spencer Clark Rd NE
- 4193 Bushnell Campbell Rd