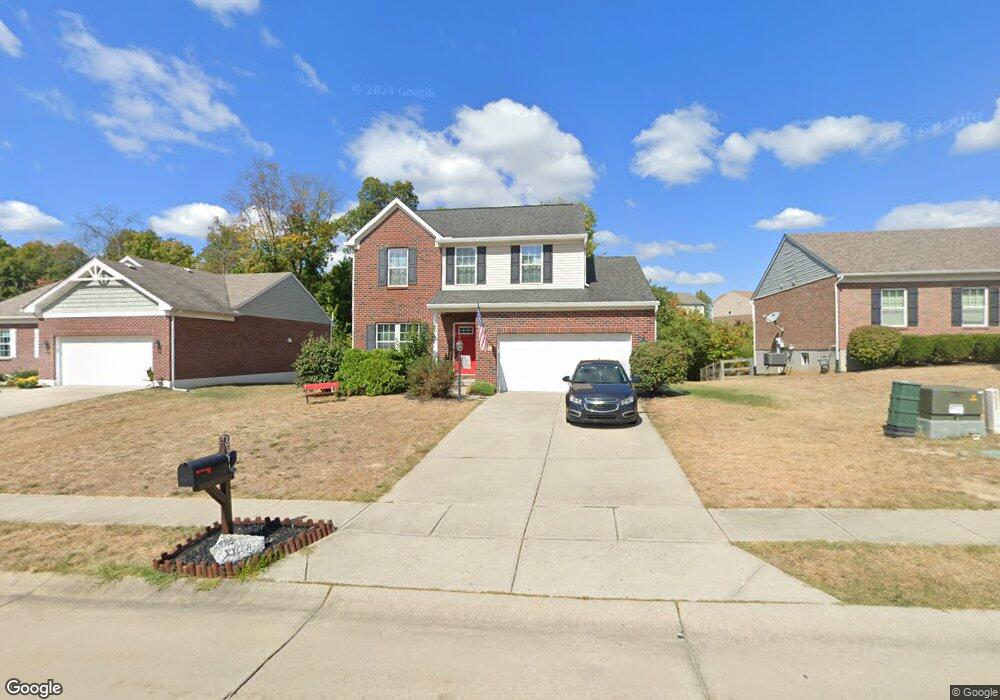
6399 Arabian Dr Independence, KY 41051
Estimated Value: $349,000 - $375,000
3
Beds
4
Baths
1,952
Sq Ft
$185/Sq Ft
Est. Value
About This Home
This home is located at 6399 Arabian Dr, Independence, KY 41051 and is currently estimated at $360,765, approximately $184 per square foot. 6399 Arabian Dr is a home located in Kenton County with nearby schools including White's Tower Elementary School, Woodland Middle School, and Scott High School.
Ownership History
Date
Name
Owned For
Owner Type
Purchase Details
Closed on
Feb 29, 2016
Sold by
Wood Richard G and Wood Maria C
Bought by
Ryles Michella L and Ryles Clyde A
Current Estimated Value
Home Financials for this Owner
Home Financials are based on the most recent Mortgage that was taken out on this home.
Original Mortgage
$176,700
Outstanding Balance
$141,099
Interest Rate
3.92%
Mortgage Type
New Conventional
Estimated Equity
$219,666
Purchase Details
Closed on
Mar 25, 2011
Sold by
Nvr Inc
Bought by
Wood Richard G and Wood Maria C
Home Financials for this Owner
Home Financials are based on the most recent Mortgage that was taken out on this home.
Original Mortgage
$177,770
Interest Rate
4.99%
Mortgage Type
FHA
Purchase Details
Closed on
Dec 14, 2010
Sold by
Charleston Signature Homes Llc
Bought by
Nvr Inc
Create a Home Valuation Report for This Property
The Home Valuation Report is an in-depth analysis detailing your home's value as well as a comparison with similar homes in the area
Home Values in the Area
Average Home Value in this Area
Purchase History
| Date | Buyer | Sale Price | Title Company |
|---|---|---|---|
| Ryles Michella L | $186,000 | Northern Kentucky Title Inc | |
| Wood Richard G | $180,215 | First Title Agency Inc | |
| Nvr Inc | $25,000 | First Title Agency Inc | |
| Holiday Homes Inc | -- | None Available |
Source: Public Records
Mortgage History
| Date | Status | Borrower | Loan Amount |
|---|---|---|---|
| Open | Ryles Michella L | $176,700 | |
| Previous Owner | Wood Richard G | $177,770 |
Source: Public Records
Tax History Compared to Growth
Tax History
| Year | Tax Paid | Tax Assessment Tax Assessment Total Assessment is a certain percentage of the fair market value that is determined by local assessors to be the total taxable value of land and additions on the property. | Land | Improvement |
|---|---|---|---|---|
| 2024 | $2,677 | $218,500 | $40,000 | $178,500 |
| 2023 | $2,757 | $218,500 | $40,000 | $178,500 |
| 2022 | $2,816 | $218,500 | $40,000 | $178,500 |
| 2021 | $2,858 | $218,500 | $40,000 | $178,500 |
| 2020 | $2,495 | $186,000 | $40,000 | $146,000 |
| 2019 | $2,502 | $186,000 | $40,000 | $146,000 |
| 2018 | $2,515 | $186,000 | $40,000 | $146,000 |
| 2017 | $2,446 | $186,000 | $40,000 | $146,000 |
| 2015 | $2,304 | $180,200 | $25,000 | $155,200 |
| 2014 | $2,272 | $180,200 | $25,000 | $155,200 |
Source: Public Records
Map
Nearby Homes
- 6388 Alexandra Ct
- 951 Stablewatch Dr
- 907 Stablewatch Dr
- 6339 Arabian Dr
- Dallas Plan at Hickory Valley
- Rockford Plan at Hickory Valley
- Avalon Plan at Hickory Valley
- Sanibel Plan at Hickory Valley
- Carlisle Plan at Hickory Valley
- Miramar Plan at Hickory Valley
- Chattanooga Plan at Hickory Valley
- Birmingham Plan at Hickory Valley
- Truman Plan at Hickory Valley
- Somerset Plan at Hickory Valley
- Hoover Plan at Hickory Valley
- 964 Stablewatch Dr
- 6269 Streamside Dr
- 6256 Woodsgrove Ct
- BRADSHAW Plan at Woods at Lakefield
- TRENT Plan at Woods at Lakefield
- 6395 Arabian Dr
- 6407 Arabian Dr
- 2777 Parkerridge Dr
- 2773 Parkerridge Dr
- 6391 Arabian Dr
- 6387 Arabian Dr
- 2769 Parkerridge Dr
- 6400 Arabian Dr
- 6396 Arabian Dr
- 2781 Parkerridge Dr
- 6392 Arabian Dr
- 6392 Arabian Dr Unit 319
- 6411 Arabian Dr
- 6404 Arabian Dr
- 6388 Arabian Dr
- 2765 Parkerridge Dr
- 6384 Alexandra Ct
- 2785 Parkerridge Dr
- 6384 Arabian Dr
- 6383 Arabian Dr