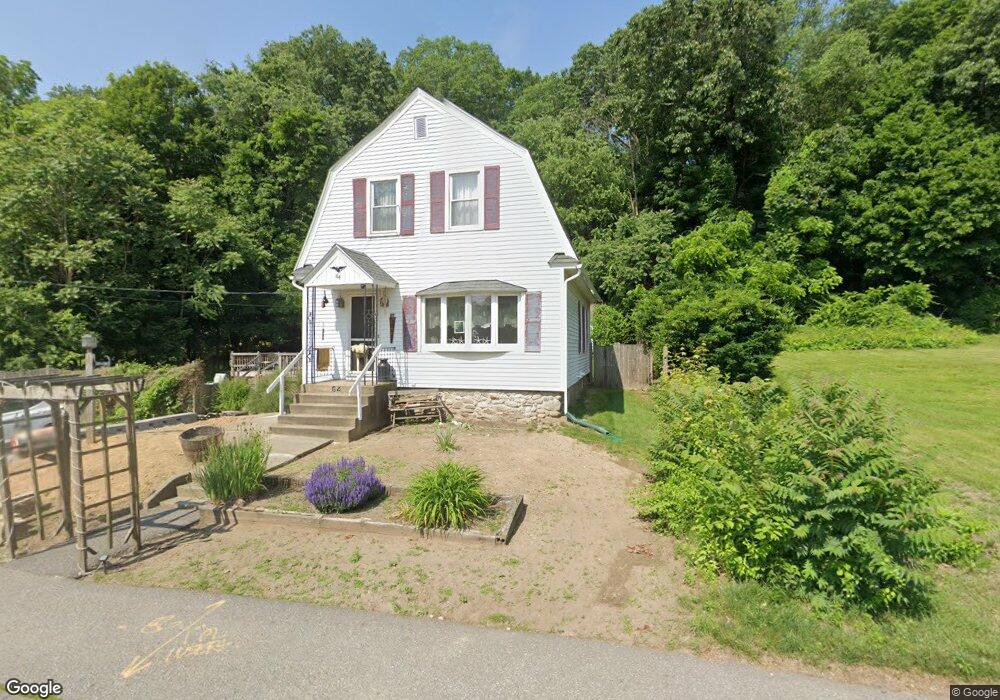
64 Boyce St Auburn, MA 01501
Stoneville NeighborhoodEstimated Value: $442,473 - $476,000
3
Beds
2
Baths
1,512
Sq Ft
$305/Sq Ft
Est. Value
About This Home
This home is located at 64 Boyce St, Auburn, MA 01501 and is currently estimated at $461,368, approximately $305 per square foot. 64 Boyce St is a home located in Worcester County with nearby schools including Auburn Senior High School, Canterbury Street School, and Shrewsbury Montessori School - Auburn Campus.
Ownership History
Date
Name
Owned For
Owner Type
Purchase Details
Closed on
Apr 28, 2006
Sold by
Libuda Richard M
Bought by
Libuda Debra A
Current Estimated Value
Home Financials for this Owner
Home Financials are based on the most recent Mortgage that was taken out on this home.
Original Mortgage
$133,500
Interest Rate
6.4%
Mortgage Type
Purchase Money Mortgage
Purchase Details
Closed on
Jun 26, 1998
Sold by
Weagle George D and Weagle Betty Jane
Bought by
Libuda Richard
Create a Home Valuation Report for This Property
The Home Valuation Report is an in-depth analysis detailing your home's value as well as a comparison with similar homes in the area
Home Values in the Area
Average Home Value in this Area
Purchase History
| Date | Buyer | Sale Price | Title Company |
|---|---|---|---|
| Libuda Debra A | -- | -- | |
| Libuda Richard | $120,800 | -- |
Source: Public Records
Mortgage History
| Date | Status | Borrower | Loan Amount |
|---|---|---|---|
| Open | Libuda Richard | $158,500 | |
| Closed | Libuda Richard | $20,000 | |
| Closed | Libuda Richard | $75,000 | |
| Closed | Libuda Debra A | $133,500 |
Source: Public Records
Tax History
| Year | Tax Paid | Tax Assessment Tax Assessment Total Assessment is a certain percentage of the fair market value that is determined by local assessors to be the total taxable value of land and additions on the property. | Land | Improvement |
|---|---|---|---|---|
| 2025 | $5,667 | $396,600 | $116,900 | $279,700 |
| 2024 | $4,903 | $328,400 | $112,300 | $216,100 |
| 2023 | $4,888 | $307,800 | $102,100 | $205,700 |
| 2022 | $4,696 | $279,200 | $102,100 | $177,100 |
| 2021 | $4,325 | $238,400 | $90,200 | $148,200 |
| 2020 | $4,161 | $231,400 | $90,200 | $141,200 |
| 2019 | $4,185 | $227,200 | $89,400 | $137,800 |
| 2018 | $3,978 | $215,700 | $83,600 | $132,100 |
| 2017 | $3,813 | $207,900 | $75,800 | $132,100 |
| 2016 | $3,215 | $177,700 | $78,400 | $99,300 |
| 2015 | $3,041 | $176,200 | $78,400 | $97,800 |
| 2014 | $2,953 | $170,800 | $74,500 | $96,300 |
Source: Public Records
Map
Nearby Homes
- 99 Clover St
- 5 Commonwealth Ave
- 177 Boyce St
- 25 Vinal St Unit 28
- 25 Vinal St Unit 26
- 25 Vinal St Unit 29
- 25 Vinal St Unit 30
- 1 Rockland Road Ct
- 204-212 Hampton St
- 177 Oxford St N
- 11 Hulbert Rd Unit 13
- 1034 Southbridge St
- 154 Pakachoag St
- 103 Henshaw St
- 31-33 Walsh Ave
- 33 Walsh Ave
- 31 Walsh Ave
- 47 Malvern Rd
- 27 Havana Rd
- 84 Eureka St
Your Personal Tour Guide
Ask me questions while you tour the home.