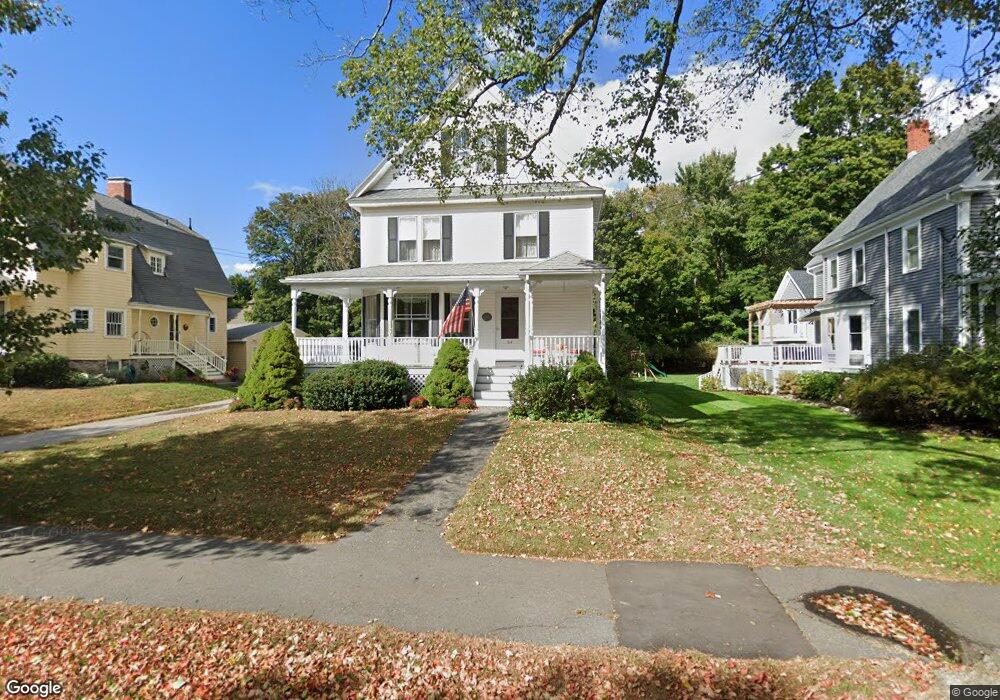
64 Chestnut St Andover, MA 01810
East Andover NeighborhoodEstimated Value: $994,462 - $1,241,000
5
Beds
2
Baths
2,290
Sq Ft
$490/Sq Ft
Est. Value
About This Home
This home is located at 64 Chestnut St, Andover, MA 01810 and is currently estimated at $1,121,866, approximately $489 per square foot. 64 Chestnut St is a home located in Essex County with nearby schools including Bancroft Elementary School, Doherty Middle School, and Andover High School.
Ownership History
Date
Name
Owned For
Owner Type
Purchase Details
Closed on
Jun 21, 2021
Sold by
Brocklesby Kathleen M
Bought by
Lak Rt and Brocklesby
Current Estimated Value
Purchase Details
Closed on
Jul 15, 1976
Bought by
Brocklesby Kathleen M
Create a Home Valuation Report for This Property
The Home Valuation Report is an in-depth analysis detailing your home's value as well as a comparison with similar homes in the area
Home Values in the Area
Average Home Value in this Area
Purchase History
| Date | Buyer | Sale Price | Title Company |
|---|---|---|---|
| Lak Rt | -- | None Available | |
| Lak Rt | -- | None Available | |
| Lak Rt | -- | None Available | |
| Brocklesby Kathleen M | $47,000 | -- |
Source: Public Records
Mortgage History
| Date | Status | Borrower | Loan Amount |
|---|---|---|---|
| Previous Owner | Brocklesby Kathleen M | $50,000 | |
| Previous Owner | Brocklesby Kathleen M | $44,000 |
Source: Public Records
Tax History Compared to Growth
Tax History
| Year | Tax Paid | Tax Assessment Tax Assessment Total Assessment is a certain percentage of the fair market value that is determined by local assessors to be the total taxable value of land and additions on the property. | Land | Improvement |
|---|---|---|---|---|
| 2024 | $10,565 | $820,300 | $478,100 | $342,200 |
| 2023 | $10,092 | $738,800 | $430,700 | $308,100 |
| 2022 | $9,673 | $662,500 | $381,200 | $281,300 |
| 2021 | $9,240 | $604,300 | $346,500 | $257,800 |
| 2020 | $8,859 | $590,200 | $338,100 | $252,100 |
| 2019 | $8,708 | $570,300 | $324,900 | $245,400 |
| 2018 | $8,313 | $531,500 | $306,400 | $225,100 |
| 2017 | $7,947 | $523,500 | $300,400 | $223,100 |
| 2016 | $7,758 | $523,500 | $300,400 | $223,100 |
| 2015 | $7,469 | $498,900 | $288,900 | $210,000 |
Source: Public Records
Map
Nearby Homes
- 61 Elm St Unit 61
- 10 Maple Ave Unit 3
- 9 Chapman Ave
- Lot 7 Weeping Willow Dr
- 105 Elm St Unit A
- 32 Lucerne Dr
- 20 Walnut Ave
- 204 Chestnut St
- 2 Powder Mill Square Unit 2B
- 42 Stevens St
- 47 Abbot St
- 5 Castle Heights Rd
- 156 High St
- 53 Salem St
- 103 Central St
- 105 Central St
- 38 Lincoln Cir E
- 1 Longwood Dr Unit 105
- 31 Porter Rd
- 170 Haverhill St Unit 138