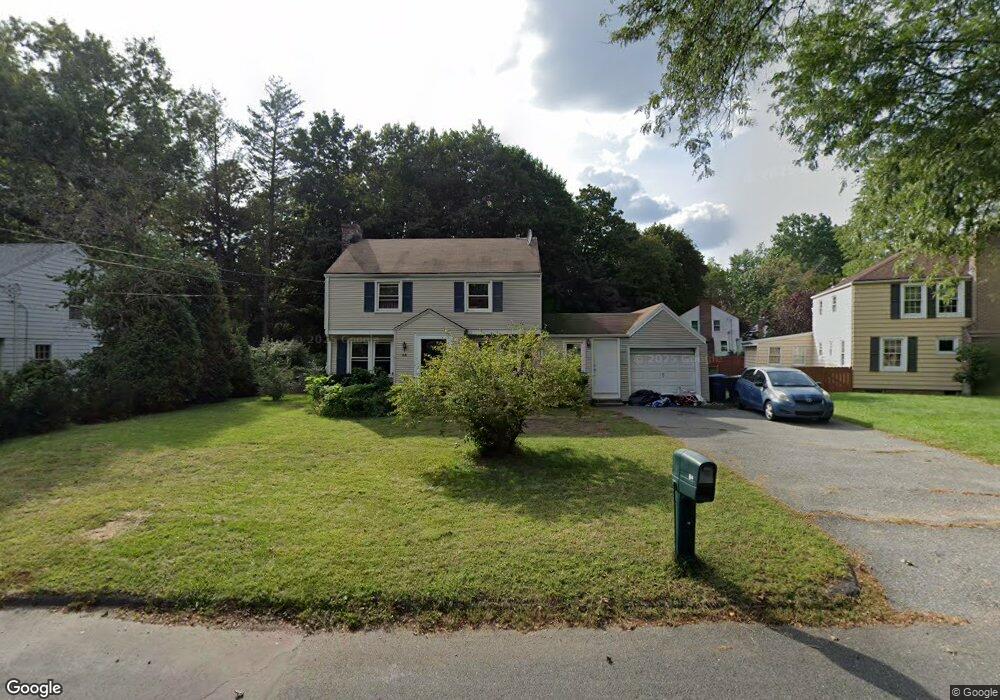
64 Donbray Rd Springfield, MA 01119
Sixteen Acres NeighborhoodEstimated Value: $325,709 - $351,000
3
Beds
2
Baths
1,318
Sq Ft
$260/Sq Ft
Est. Value
About This Home
This home is located at 64 Donbray Rd, Springfield, MA 01119 and is currently estimated at $342,427, approximately $259 per square foot. 64 Donbray Rd is a home located in Hampden County with nearby schools including Glickman Elementary, John J Duggan Middle, and Springfield High School of Science and Technology.
Ownership History
Date
Name
Owned For
Owner Type
Purchase Details
Closed on
Jan 28, 2011
Sold by
Luttrell Jeffrey J and Luttrell Julie
Bought by
Goodwin Steven D
Current Estimated Value
Home Financials for this Owner
Home Financials are based on the most recent Mortgage that was taken out on this home.
Original Mortgage
$112,500
Interest Rate
4.83%
Purchase Details
Closed on
Dec 17, 2001
Sold by
Kenyon Jeffrey E and Macdonald Carrie L
Bought by
Luttrell Jeffrey J
Home Financials for this Owner
Home Financials are based on the most recent Mortgage that was taken out on this home.
Original Mortgage
$111,746
Interest Rate
6.6%
Mortgage Type
Purchase Money Mortgage
Purchase Details
Closed on
Apr 23, 1993
Sold by
Glb Corp
Bought by
Kenyon Jeffrey E and Macdonald Carrie L
Purchase Details
Closed on
Dec 14, 1992
Sold by
Bogan David L and Bogan Jean W
Bought by
Glb Corp
Create a Home Valuation Report for This Property
The Home Valuation Report is an in-depth analysis detailing your home's value as well as a comparison with similar homes in the area
Home Values in the Area
Average Home Value in this Area
Purchase History
| Date | Buyer | Sale Price | Title Company |
|---|---|---|---|
| Goodwin Steven D | $145,000 | -- | |
| Luttrell Jeffrey J | $113,500 | -- | |
| Kenyon Jeffrey E | $84,000 | -- | |
| Glb Corp | $100,000 | -- |
Source: Public Records
Mortgage History
| Date | Status | Borrower | Loan Amount |
|---|---|---|---|
| Closed | Glb Corp | $112,500 | |
| Previous Owner | Glb Corp | $111,746 | |
| Previous Owner | Glb Corp | $9,500 |
Source: Public Records
Tax History
| Year | Tax Paid | Tax Assessment Tax Assessment Total Assessment is a certain percentage of the fair market value that is determined by local assessors to be the total taxable value of land and additions on the property. | Land | Improvement |
|---|---|---|---|---|
| 2025 | $4,928 | $314,300 | $52,000 | $262,300 |
| 2024 | $4,945 | $307,900 | $52,000 | $255,900 |
| 2023 | $4,593 | $269,400 | $49,500 | $219,900 |
| 2022 | $4,464 | $237,200 | $49,500 | $187,700 |
| 2021 | $4,226 | $223,600 | $45,000 | $178,600 |
| 2020 | $3,836 | $196,400 | $45,000 | $151,400 |
| 2019 | $3,727 | $189,400 | $45,000 | $144,400 |
| 2018 | $4,066 | $191,700 | $45,000 | $146,700 |
| 2017 | $3,718 | $189,100 | $44,900 | $144,200 |
| 2016 | $3,525 | $179,300 | $44,900 | $134,400 |
| 2015 | $3,159 | $160,600 | $44,900 | $115,700 |
Source: Public Records
Map
Nearby Homes
- Lot 37 Kane St
- 186 Bolton St
- 235 Starling Rd
- 39 Groton St
- 38 Northway Dr
- 121 Mallowhill Rd
- 854 Grayson Dr
- 244 Nassau Dr Unit 244
- 25 Nassau Dr Unit 25
- 72 Nassau Dr
- 173 Nassau Dr
- 88 Senator St
- 74 Valley Rd
- 56 Rosemary Dr
- 130 Spear Rd
- 19 Annies Way
- 322 Gilbert Ave
- 56 Contessa Ln
- 239 Gresham St
- 195 Almira Rd
Your Personal Tour Guide
Ask me questions while you tour the home.